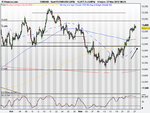
Hi again, have looked for some early ducks, some are lining up but the MAs are looking flat, the US/CHF looks good though and so I have gone short at 0.92720 with a s/l of 33.
4 hours to bed time so feel free to comment, advise etc.
Cheers, steve
Hi StephenSteve
I dont trade this system, but i have read the thread and am familiar with PA trading, so I will add some comments. A concern is you are approaching some key levels which may provide support.
However I would add that you're probably better off looking back at Nigel-Ps charts and seeing how he would trade/where he sticks his entry approaching key levels.
First of all, what is your target profit (TP)? Have you demo'd this method and confident that you can aim for 1:2 RR? These are things you should have an idea of when trying out new system. Your RR for this method maybe different to someone else trading same method as you prefer to jump in & out quickly - a few times a day, whereas someone else maybe looking for jumping on the trend and holding for days, locking in profits on the way.
Second, why have you put your SL at -33? Looking at its not too bad a place, above the recent range bound asia highs, others may disagree.
USD/CHF
There are possible support levels just below your entry
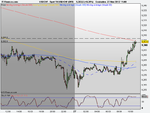
~ @ 9215-9255 on daily (inc the new recent low on M15; I treat this as big support/supply zone, and personally would not look to short until it breaks this zone and holds below, but i trade completely differently).
So I would expect some support (supply) at these levels, and price has found support at H4 9250 area and bounced off it slightly. If it breaks the 9250 and holds, then will it break the prev low of 9220? If your TP is here, then fine. So the question is do you want to be entering just before support levels? You are hoping it breaks through, so maybe you want to be placing a stop entry just below the level - to catch a breakout as its happening, but with a tight stop in case its a fake breakout. Others may wait for price to break through, and then stick limit sell in @ 9250 waiting for a retest of the prev support which is now a resistance level.
Other things to think of if you are near support/resistance levels are the number of times (and how recent) price has come back to this level - which may help you gauge how strong the level is. Has priced bounced off it aggressively - how long ago?; has price recently repeatedly tried to break through it, and is consolidating just above soaking up supply side? Is price now forming an inverted head & shoulders pattern on the H1 indicating a reversal in the trend etc etc? (There was a prev inverted H&S on the daily).
As simple as this method is to trade there is still plenty to learn about price action / TA for your entry/exits. You have to find out what you are comfortable with, again theres plenty of tips in Nigel Ps posts (i think he recently mentioned he only trades 1 type of set up), and loadsa other places on the web (for free).
G/L.