TA, PA, and Supp/Res

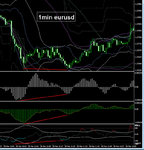
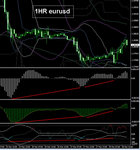
Re PA your 5min chart shows perfectly that on 1st test shown on that t/f there were buyers willing to transact there - price pulls back and on a 2nd slightly lower test on this t/f - buyers emerged again...no real divergence in the momentum oscillators (save for same valley div) on this 5min t/f but divergence present on 1min, 30min and 1hr - and on this 1hr t/f - double divergence in the osma - so on each consecutive swing lower on this 1hr t/f momentum was diminishing (potentially) - that was the indication...of course if acting on a sub 30min t/f pa trigger that bullish div on 30min and 1hr would not have been confirmed by pa on those t/f's - but it was 'potentially' there nonetheless.

I think it is about getting the highest degree of confluence re potential sup/res factors and other factors you may choose to use (like divergence etc) and see-ing if PA agrees with the working assumption that - in this eg - buyers may be present at such a potential sup zone...and if possible developing this into a rule set for your edge - if you trade this way.


G/L


Quite interesting that, bb. The first hit on the support zone seemed to have a lot of oomph behind it (on M5 too) so my money would have been on a break. Not to be and the second dip half an hour later had much less momentum behind it and seemed the better bet for a reversal even though it made a slightly lower low.

Be interested how you take account of momentum and how you judge it.
 

Attachments

  • z1min.jpg
    z1min.jpg
    133.5 KB · Views: 289
  • z1hr.jpg
    z1hr.jpg
    123.3 KB · Views: 254
Just to add for your consideration. Think about what is going on in those candles with the 'tails'. Why are they there? Who is creating them? What do they indicate about current price development and potential future development.

It's very important to understand what these 'tails' tell you, especially around areas of support and resistance.
 
Moving averages, trendlines, and trend channel lines are also areas of potential support/resistance. Also remember that once broken, support becomes resistance and vice versa.
Hi georgedon,
With reference to point #2 in bbmac's OP, potentially, I think this is right up there in the misconceptions hall of fame about MAs, S&R lines and trendlines. I say 'potentially', because it depends on what you mean. If you mean that market participants have reacted (i.e. bought or sold) at specific levels in the past and may do so again at the same levels (in the event that price returns to them) then I agree with you. That's their value and why they're worth adding to our charts. However, if you believe that price reacts to the MAs, trendlines or S&R lines themselves, and that these lines have some magical power to attract and reject price then, IMO, this is symptomatic of seriously flawed thinking that is common amongst so many retail traders.

I don't have to hand the figures for retail traders speculating in Forex (i.e. us lot), but the numbers are small, very small. (I'm referring to overall transaction size - not the numbers of people.) Most transactions occur for all manner of reasons, but one thing's for sure: they sure as hell don't take place because some retail Joe trading in his/her back bedroom in South Penge has a MA, S&R line or trendline drawn on their free chart provided by their spread betting firm! The one possible exception to this might be a 50 and 200MA on a daily chart - but that's about it. For anyone who clings to the idea that MAs and trendlines in and of themselves act as S&R, rather than key price levels, I urge you think hard about the following . . .

1. How does the market know to respond to said MAs, S&R lines and trendlines drawn on your charts, but not to the ones drawn on mine?
2. How do the IBs, hedge funds and institutions who are responsible for moving the markets know where the MAs, S&R lines and trendlines are - given that they rarely pay any attention to charts? After all, it's mostly only retail traders like us that trade from charts. Even the jaw of Derren Brown would drop at witnessing that trick - if it could be pulled off!
3. Lastly, it's only possible to add S&R lines and trendlines after stand out highs and lows have printed on the chart. So, which comes first: price action or us lot adding lines to our charts?

Some members might ask, 'what difference does it make?' After all, if price action and the MAs, S&R lines and trendlines all coincide - it surely doesn't matter? Wrong, I'm afraid it matters a lot. The reason why is to do with belief and expectation. As soon as we start to attribute greater importance and significance to any kind of 'indicator' (which includes S&R lines and chart 'patterns' etc.) - we're likely to end up being disappointed if price doesn't then do what the MAs, S&R lines and trendlines 'indicate' that it should do. We had faith and confidence in them and duly expected price to react to them in the way the lines indicated it 'should'. When that doesn't happen, we end up suffering a loss and ranting and raving that indicators of all types, trendlines, S&R or TA in general simply doesn't work. All of them work just fine. It's our misplaced belief about them and our unreasonable expectation that the market will respect them that's the problem. The market doesn't know where your MAs, S&R lines and trendlines are. It's not aware it's created a H&S pattern and you've drawn in a 'neckline' that it's supposed to burst through or bounce off. It can't see the bull flag pattern on a 1,743 volume chart or the ascending triangle on my 3.14 P&F chart. And, even if it was aware of these and a million and one other patterns and lines on all the charts of every retail trader out there, it doesn't give a ****!
;)
Tim.
 
Last edited:
Hi georgedon,
With reference to point #2 in bbmac's OP, potentially, I think this is right up there in the misconceptions hall of fame about MAs, S&P lines and trendlines. I say 'potentially', because it depends on what you mean. If you mean that market participants have reacted (i.e. bought or sold) at specific levels in the past and may do so again at the same levels (in the event that price returns to them) then I agree with you. That's their value and why they're worth adding to our charts. However, if you believe that price reacts to the MAs, trendlines or S&P lines themselves, and that these lines have some magical power to attract and reject price then, IMO, this is symptomatic of seriously flawed thinking that is common amongst so many retail traders.

I don't have to hand the figures for retail traders speculating in Forex (i.e. us lot), but the numbers are small, very small. (I'm referring to overall transaction size - not the numbers of people.) Most transactions occur for all manner of reasons, but one thing's for sure: they sure as hell don't take place because some retail Joe trading in his/her back bedroom in South Penge has a MA, S&P line or trendline drawn on their free chart provided by their spread betting firm! The one possible exception to this might be a 50 and 200MA on a daily chart - but that's about it. For anyone who clings to the idea that MAs and trendlines in and of themselves act as S&P, rather than key price levels, I urge you think hard about the following . . .

1. How does the market know to respond to said MAs, S&P lines and trendlines drawn on your charts, but not to the ones drawn on mine?
2. How do the IBs, hedge funds and institutions who are responsible for moving the markets know where the MAs, S&P lines and trendlines are - given that they rarely pay any attention to charts? After all, it's mostly only retail traders like us that trade from charts. Even the jaw of Derren Brown would drop at witnessing that trick - if it could be pulled off!
3. Lastly, it's only possible to add S&P lines and trendlines after stand out highs and lows have printed on the chart. So, which comes first: price action or us lot adding lines to our charts?

Some members might ask, 'what difference does it make?' After all, if price action and the MAs, S&P lines and trendlines all coincide - it surely doesn't matter? Wrong, I'm afraid it matters a lot. The reason why is to do with belief and expectation. As soon as we start to attribute greater importance and significance to any kind of 'indicator' (which includes S&P lines and chart 'patterns' etc.) - we're likely to end up being disappointed if price doesn't then do what the MAs, S&P lines and trendlines 'indicate' that it should do. We had faith and confidence in them and duly expected price to react to them in the way the lines indicated it 'should'. When that doesn't happen, we end up suffering a loss and ranting and raving that indicators of all types, trendlines, S&P or TA in general simply doesn't work. All of them work just fine. It's our misplaced belief about them and our unreasonable expectation that the market will respect them that's the problem. The market doesn't know where your MAs, S&P lines and trendlines are. It's not aware it's created a H&S pattern and you've drawn in a 'neckline' that it's supposed to burst through or bounce off. It can't see the bull flag pattern on a 1,743 volume chart or the ascending triangle on my 3.14 P&F chart. And, even if it was aware of these and a million and one other patterns and lines on all the charts of every retail trader out there, it doesn't give a ****!
;)
Tim.

You forgot to add that the 'pepole' who know what they are doing use these 'patterns' to create the exact opposite of what is expected. Very cunning they are :cool:
 
Hold the front page

Hi georgedon,
With reference to point #2 in bbmac's OP, potentially, I think this is right up there in the misconceptions hall of fame about MAs, S&P lines and trendlines. I say 'potentially', because it depends on what you mean. If you mean that market participants have reacted (i.e. bought or sold) at specific levels in the past and may do so again at the same levels (in the event that price returns to them) then I agree with you. That's their value and why they're worth adding to our charts. However, if you believe that price reacts to the MAs, trendlines or S&P lines themselves, and that these lines have some magical power to attract and reject price then, IMO, this is symptomatic of seriously flawed thinking that is common amongst so many retail traders.

I don't have to hand the figures for retail traders speculating in Forex (i.e. us lot), but the numbers are small, very small. (I'm referring to overall transaction size - not the numbers of people.) Most transactions occur for all manner of reasons, but one thing's for sure: they sure as hell don't take place because some retail Joe trading in his/her back bedroom in South Penge has a MA, S&P line or trendline drawn on their free chart provided by their spread betting firm! The one possible exception to this might be a 50 and 200MA on a daily chart - but that's about it. For anyone who clings to the idea that MAs and trendlines in and of themselves act as S&P, rather than key price levels, I urge you think hard about the following . . .

1. How does the market know to respond to said MAs, S&P lines and trendlines drawn on your charts, but not to the ones drawn on mine?
2. How do the IBs, hedge funds and institutions who are responsible for moving the markets know where the MAs, S&P lines and trendlines are - given that they rarely pay any attention to charts? After all, it's mostly only retail traders like us that trade from charts. Even the jaw of Derren Brown would drop at witnessing that trick - if it could be pulled off!
3. Lastly, it's only possible to add S&P lines and trendlines after stand out highs and lows have printed on the chart. So, which comes first: price action or us lot adding lines to our charts?

Some members might ask, 'what difference does it make?' After all, if price action and the MAs, S&P lines and trendlines all coincide - it surely doesn't matter? Wrong, I'm afraid it matters a lot. The reason why is to do with belief and expectation. As soon as we start to attribute greater importance and significance to any kind of 'indicator' (which includes S&P lines and chart 'patterns' etc.) - we're likely to end up being disappointed if price doesn't then do what the MAs, S&P lines and trendlines 'indicate' that it should do. We had faith and confidence in them and duly expected price to react to them in the way the lines indicated it 'should'. When that doesn't happen, we end up suffering a loss and ranting and raving that indicators of all types, trendlines, S&P or TA in general simply doesn't work. All of them work just fine. It's our misplaced belief about them and our unreasonable expectation that the market will respect them that's the problem. The market doesn't know where your MAs, S&P lines and trendlines are. It's not aware it's created a H&S pattern and you've drawn in a 'neckline' that it's supposed to burst through or bounce off. It can't see the bull flag pattern on a 1,743 volume chart or the ascending triangle on my 3.14 P&F chart. And, even if it was aware of these and a million and one other patterns and lines on all the charts of every retail trader out there, it doesn't give a ****!
;)
Tim.

Tim - your excellent post should be a "stickie" on every thread (y)
 
Hi georgedon,
With reference to point #2 in bbmac's OP, potentially, I think this is right up there in the misconceptions hall of fame about MAs, S&R lines and trendlines. I say 'potentially', because it depends on what you mean. If you mean that market participants have reacted (i.e. bought or sold) at specific levels in the past and may do so again at the same levels (in the event that price returns to them) then I agree with you. That's their value and why they're worth adding to our charts. However, if you believe that price reacts to the MAs, trendlines or S&R lines themselves, and that these lines have some magical power to attract and reject price then, IMO, this is symptomatic of seriously flawed thinking that is common amongst so many retail traders.

I don't have to hand the figures for retail traders speculating in Forex (i.e. us lot), but the numbers are small, very small. (I'm referring to overall transaction size - not the numbers of people.) Most transactions occur for all manner of reasons, but one thing's for sure: they sure as hell don't take place because some retail Joe trading in his/her back bedroom in South Penge has a MA, S&R line or trendline drawn on their free chart provided by their spread betting firm! The one possible exception to this might be a 50 and 200MA on a daily chart - but that's about it. For anyone who clings to the idea that MAs and trendlines in and of themselves act as S&R, rather than key price levels, I urge you think hard about the following . . .

1. How does the market know to respond to said MAs, S&R lines and trendlines drawn on your charts, but not to the ones drawn on mine?
2. How do the IBs, hedge funds and institutions who are responsible for moving the markets know where the MAs, S&R lines and trendlines are - given that they rarely pay any attention to charts? After all, it's mostly only retail traders like us that trade from charts. Even the jaw of Derren Brown would drop at witnessing that trick - if it could be pulled off!
3. Lastly, it's only possible to add S&R lines and trendlines after stand out highs and lows have printed on the chart. So, which comes first: price action or us lot adding lines to our charts?

Some members might ask, 'what difference does it make?' After all, if price action and the MAs, S&R lines and trendlines all coincide - it surely doesn't matter? Wrong, I'm afraid it matters a lot. The reason why is to do with belief and expectation. As soon as we start to attribute greater importance and significance to any kind of 'indicator' (which includes S&R lines and chart 'patterns' etc.) - we're likely to end up being disappointed if price doesn't then do what the MAs, S&R lines and trendlines 'indicate' that it should do. We had faith and confidence in them and duly expected price to react to them in the way the lines indicated it 'should'. When that doesn't happen, we end up suffering a loss and ranting and raving that indicators of all types, trendlines, S&R or TA in general simply doesn't work. All of them work just fine. It's our misplaced belief about them and our unreasonable expectation that the market will respect them that's the problem. The market doesn't know where your MAs, S&R lines and trendlines are. It's not aware it's created a H&S pattern and you've drawn in a 'neckline' that it's supposed to burst through or bounce off. It can't see the bull flag pattern on a 1,743 volume chart or the ascending triangle on my 3.14 P&F chart. And, even if it was aware of these and a million and one other patterns and lines on all the charts of every retail trader out there, it doesn't give a ****!
;)
Tim.

There is evidence of 4 hour charts /daily charts where there are high probability entries to be had.Supports are usually seen better on 4 h and daily charts 2 sets of troughs = supports or 2 sets of peaks = resistances , they give you an edge buying at stock indices.

Follow this thread and the system , will make you a better trader , not just a good writer who writes well , don't beat around the bush ....there are clear tradeable supports and resistances. intermarket supports here , more information on it than on the instrument traded

http://www.trade2win.com/boards/edu...y-trading-system-75-hit-rate.html#post2891624

http://www.trade2win.com/boards/edu...y-trading-system-75-hit-rate.html#post2891164

3.8 Resistances Compulsory filter
• For long positions price has to sit (close) above resistance with full 30 min candle or at least with more than half of 30 min. candle real body closed above resistance.
• Have you seen resistance become support on several points?
• Don’t open long position if major resistance level price is less than 20 pips away from current price.
• Is there newly formed resistance or down channel/slope on tick charts? Close long open position if formed!
• Do not buy against newly formed resistance. Close open position if formed!
• Do not buy below resistances ,tops of channels or below moving averages

3.9 Supports Compulsory filter
• For short positions price has to sit (close) below support with full 30 min candle or at least with more than half of 30 min. candle real body closed below support.
• Have you seen support become resistance on several points?
• Don’t open short position if major support level price is less than 20 pips away from current price.
• Is there newly formed support or up channel/slope on tick charts? Close open short position if formed!
• Do not sell against newly formed support. Close open position if formed!
Do not sell above support, bottoms of channels or above moving averages
 
Top