TA, PA, and Supp/Res

bbmac

Veteren member
Messages
3,584
Likes
789
Some observations;

1. TA is not an exact science.
2. See 1.above - this notwithstanding - some analysis /use of TA is just plain wrong.

3. Not all PA can tell you what the greater probability of future PA is.
4. The greater probability doesn't always play out.
5. PA alone - on all instruments, cannot tell you everything you may need/want to know.

6. Support/Resistance should be more accurately called 'potential supp/res.'
7. The more times pot supp/res gets hi the generally weaker it becomes in it's ability to act as such on a subsequent test.
8. Of all pot supp/res factors - the most important are the previous price pivots.
9. It is how price arrives at re PA as well as PA at pot supp/res that can (not always) give a clue as to the greater probability - ie break or bounce at such pot supp/res.
10. Conversely to part of point 9. above - it is how price bounces from pot supp/res that can tell you how strong it is.


G/L
 
Last edited:
2: can you quantify which TA is plain wrong, to focus in on TA that is worth exploring?

Point 4 is tautological.
If people don't understand "probability", then "greater probability" will go over their heads.
The analogy of horse racing, where the (greater probability) favourite doesn't always win.

8: are you using "price pivot" in the trading sense, or as a metaphor? (to avoid ambiguity)
(EDIT: I wondered if the phrase could be confused with pivot points.)

Good start though!
 
2. Stuff you read on trading forums in particular - common mistakes are the way channels are drawn, gauging whether an instrument is trending or ranging, and what constitutes potential sup/res. To some extent TA can be subjective but even so - there exists accepted rights and wrongs in it's applications.

4. The greater probability is all we have - none of us know what will happen next re price but our repeating set-ups/edge can give an indication as to the greater probability - based on historical precedent of the set-up/edge developing - whether or not that greater probability plays out on that particular occasion.

8. I am using the term previous price pivots (ppp) in the sense of previous obvious near-term fractal price swing hi and lo's that show us where an imbalance of supply/demand and demand/supply existed sufficient to see price fall/rise respectively. Pivot points as you know and as are commonly understood - are calculated from price but do not necessarily fall at a ppp.

G/L

2: can you quantify which TA is plain wrong, to focus in on TA that is worth exploring?

Point 4 is tautological.
If people don't understand "probability", then "greater probability" will go over their heads.
The analogy of horse racing, where the (greater probability) favourite doesn't always win.

8: are you using "price pivot" in the trading sense, or as a metaphor? (to avoid ambiguity)
(EDIT: I wondered if the phrase could be confused with pivot points.)

Good start though!
 
This is exactly what I had hoped to find when joining this site. Insightful analysis and fresh thinking honed by obvious experience of the markets. I've read widely on the subject, but other than the real basics, the rest all begins to sound the same after a while - even those that predictably take an opposing view to the heterodoxy purely for the sake of it.

This stuff however is clean and fresh and thought provoking - to me anyway.

bbmac - thanks for your views and I'd like to think I will be able to interact constructively in this thread, albeit as a fairly basic level.
 
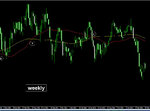
Below is the current Gbpusd spot weekly chart....I have read from many sources on forums and other trading related sites that this weekly t/f is in a downtrend - I dispute this...unusually re opa (overall price action) -previous price swing hi/lo analysis it has gone from a HH to a LL and has really just broken out to the downside of the previous range bottom and has pulled back to it from that underside. Daily - yeh there is still an opa downtrend but on this weekly t/f - not.


G/L
 

Attachments

  • wkly.jpg
    wkly.jpg
    167 KB · Views: 458
I have been thinking it was in a down trend since 50ma [red] last crossed below 100ma [yellow?]

Am I wrong in this?
 

Attachments

  • pound.jpg
    pound.jpg
    124.3 KB · Views: 425
So what would the price have to do on that weekly for you to decide it was in a downward trend? I presume being rebuffed at the 5300 level would be a candidate, but if this week and next week produced down bars and 5300 was increasingly unlikely to be tested, would that be enough?

It's barely made it back up to the 23.6 Fib level from the December high and if it didn't make a HH this week or next, technically this would indicate a lack of upward pressure, but I just wonder what it is I'm missing in my analysis.
 
Moving averages, trendlines, and trend channel lines are also areas of potential support/resistance. Also remember that once broken, support becomes resistance and vice versa.
 
Below is the current Gbpusd spot weekly chart....I have read from many sources on forums and other trading related sites that this weekly t/f is in a downtrend - I dispute this...unusually re opa (overall price action) -previous price swing hi/lo analysis it has gone from a HH to a LL and has really just broken out to the downside of the previous range bottom and has pulled back to it from that underside. Daily - yeh there is still an opa downtrend but on this weekly t/f - not.


G/L

Well, it's broken through previous support zone and, at first glance, it looks as though that support may have become resistance and a lower low would confirm that as well as a down trend .

As you said to start with, it's not a science but it does give you places where it's reasonable to make some assumption about where price might go and trade accordingly.
 
Well look at what happened to price when your 50ma crossed below the 100ma at point a, then up above it at point b and then down back through it again at point c ! - would you say that pa was in a downtrend on this t/f at any time re overall price action when these ma's crossed ? OPA is a better way of determining what state a market instrument is in on any given t/f, ie

i. classically ranging,
ii. classically trending,

or

iii. generally trending.

G/L


I have been thinking it was in a down trend since 50ma [red] last crossed below 100ma [yellow?]

Am I wrong in this?
 

Attachments

  • z.jpg
    z.jpg
    106.5 KB · Views: 400
A LH or H and a 2nd LL would constitute an opa downtrend for me in this weekly gbpusd t/f.

G/L

QUOTE=Purple Brain;2103314]So what would the price have to do on that weekly for you to decide it was in a downward trend? I presume being rebuffed at the 5300 level would be a candidate, but if this week and next week produced down bars and 5300 was increasingly unlikely to be tested, would that be enough?

It's barely made it back up to the 23.6 Fib level from the December high and if it didn't make a HH this week or next, technically this would indicate a lack of upward pressure, but I just wonder what it is I'm missing in my analysis.[/QUOTE]
 
Below is the current Gbpusd spot weekly chart....I have read from many sources on forums and other trading related sites that this weekly t/f is in a downtrend - I dispute this...unusually re opa (overall price action) -previous price swing hi/lo analysis it has gone from a HH to a LL and has really just broken out to the downside of the previous range bottom and has pulled back to it from that underside. Daily - yeh there is still an opa downtrend but on this weekly t/f - not.


G/L

I think one of the important things is that you have some ideas about this, and you are consistent in them. It's clear to you that this is not a trend on the weekly, and there is little room for argument on that (with you). Which means you have no doubts and a clear idea, which is good.

So if you do not conclude that it is in a downtrend, that's fine. The question is how useful is that to your trades? The down move on GPBUSD since the start of the year is larger than the entire range of the previous year in only a few months. If you were a weekly trader, you'd perhaps be missing a massive move because you consider it still ranging (or perhaps you would play the range and do well). If it reverses now back into the range, then your definition of trend may have kept you out of some losing trades below the range. But if it also made you miss the move, then there's a cost there.

And so often, the safety of being right is weighed off against the value of getting in early on the move. I don't consider one wrong and the other right. More a choice - how much confirmation and confluence do you want. For me that GBPUSD chart is in a downtrend for many weeks.
 
Yeh, there are a number of technical factors that can cause support or resistance (not '...are...' as you say - ie not always- it's not a given - if it was price would never move very far!) - and you name some of them...what you have to figure out is what potential sup/res factors are historically more likely to, on what t/f's and in what confluences..and then of course observe the way price reaches and how it reacts at such - which may (not always) give a heads up as to the greater probability - ie a break thru or bounce at such. Re support or resistance being broken to the down/upside respectively - it doesn't always follow that support becomes resistance or resistance becomes support (see my point above) - ie the previous sup/res becomes potential SBR/RBS and again you have to figure out in what overall price action conditions it is most likely to.

G/L

Moving averages, trendlines, and trend channel lines are also areas of potential support/resistance. Also remember that once broken, support becomes resistance and vice versa.
 
I agree...but the assumption must be backed up by PA and in the context of OPA (for me anyway.)

G/L

Well, it's broken through previous support zone and, at first glance, it looks as though that support may have become resistance and a lower low would confirm that as well as a down trend .

As you said to start with, it's not a science but it does give you places where it's reasonable to make some assumption about where price might go and trade accordingly.
 
Oanda website shows 61% of retail traders currently long 39% short, that increases the chance of a smackdown.
 
Some technical potential sup/res factors are historically more likely to cause a price swing from the prevailing price action leading to them - than others, on any given t/f. Very often it is about the confluence of such potential factors as to whether this probability may play out...then of course it is about PA at such as to whether this becomes the greater probability...as to whether this will be a pullback/extended pullback or out and out reversal of the prevailing PA to it - well that's a whole other story lol.

G/L
 
Thanks for the explanation - I can see I may have to reconsider my way of assessing if there is a trend or not.


Well look at what happened to price when your 50ma crossed below the 100ma at point a, then up above it at point b and then down back through it again at point c ! - would you say that pa was in a downtrend on this t/f at any time re overall price action when these ma's crossed ? OPA is a better way of determining what state a market instrument is in on any given t/f, ie

i. classically ranging,
ii. classically trending,

or

iii. generally trending.

G/L
 
My last post refers....an eg;

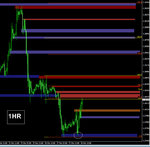
Look where eurusd found support today - it sold off down to the previous 1hr/4hr swing lo zone and this was in a wider previous minor daily swing lo zone - so we knew their was a near-term and longer term historical imbalance of demand/supply there that caused price to rise....it was the 2nd test therefore of the daily zone and the 1st test of the 1hr/4hr zone - so a reasonable working assumption was that all demand may not have been eroded by supply on multiple tests - ie the zone was potentially significant in terms of confluence and that therefore depending on Pa [in particular] it may offer an opportunity to get long.


G/L
 

Attachments

  • z1.jpg
    z1.jpg
    113.9 KB · Views: 341
  • zd.jpg
    zd.jpg
    133.8 KB · Views: 299
Re potential RBS that was mentioned earlier - price made a L on 1hr on the re-test of that potential support and after the strong bounce a 2nd HH (not fractal at the point of the pullback that is shown by the descending arrow - price pulling back to the previous swing hi zone on this t/f where it found new buy the pullback demand as resistance did become support - ie this was hi probability as price was showing a willingness to move higher had bounced strongly off support after a HH and a lot of HL's and made a new HH above that.

Ie: Some opa scenarios are generally higher in probability than others for potential rbs/sbr.

G/L
 

Attachments

  • z1.jpg
    z1.jpg
    98.9 KB · Views: 329
Re potential RBS that was mentioned earlier - price made a L on 1hr on the re-test of that potential support and after the strong bounce a 2nd HH (not fractal at the point of the pullback that is shown by the descending arrow - price pulling back to the previous swing hi zone on this t/f where it found new buy the pullback demand as resistance did become support - ie this was hi probability as price was showing a willingness to move higher had bounced strongly off support after a HH and a lot of HL's and made a new HH above that.

Ie: Some opa scenarios are generally higher in probability than others for potential rbs/sbr.

G/L


Quite interesting that, bb. The first hit on the support zone seemed to have a lot of oomph behind it (on M5 too) so my money would have been on a break. Not to be and the second dip half an hour later had much less momentum behind it and seemed the better bet for a reversal even though it made a slightly lower low.

Be interested how you take account of momentum and how you judge it.
 
Top