You are using an out of date browser. It may not display this or other websites correctly.
You should upgrade or use an alternative browser.
You should upgrade or use an alternative browser.
Interceptor
Member
- Messages
- 99
- Likes
- 1
By the way, I have a 100% negative record in 'guessing' index directions!
Indicators-keeping stupid people out of trouble for 40 years.
Indicators-keeping stupid people out of trouble for 40 years.
Interceptor
Member
- Messages
- 99
- Likes
- 1
Short @ 5278.5
Stopped out already. Doh!
Yes, I think that for contrary trading the Footsie, we might have to wait until the Dow opens.
I'm still following my tactic of June, July and am only trading pullbacks. These bounces and breakouts are for the youngsters in the team!
Even so, as I said earlier, I'm cooling off on the day trading, anyway.
Interceptor
Member
- Messages
- 99
- Likes
- 1
5300 area -support becoming resistance?
Chelski
Well-known member
- Messages
- 487
- Likes
- 5
ADVFN chart suggests a tiny gap between today's high and yesterday's low: if this does not close by 4:30 I will enter a buy order just above yesterday's low, leaving it open until Wednesday night.
I use esignal and also have that gap. Todays high was 5359.3 and yesterdays close 5362.1 There is also a gap from Tuesdays close at 5620.7 that remains in place as Wednesdays open was 5593.8. Would be a nice trade if that got filled!
Interceptor
Member
- Messages
- 99
- Likes
- 1
WOW!!!
Now that was impressive, following the US news release.
Now that was impressive, following the US news release.
Wolfe wave projection points down
I have read of these but only looking at them in detail today. It looks to me as if Points 1, 2 and 3 are already in place in a bearish set-up. I can't attach the file showing this as the Manage Attachments pane keeps telling me that my jpeg has the wrong extension, but its a simple set-up.
On your regular FTSE swing bar chart,
Pt 1 = high of swing high 12/08
Pt 2 = low of swing low 21/08
Pt 3 = high of last swing high 29/08
Connect Points 1 and 3 and extend this line into the future. Take Point 4 to be the low of the next swing low - not confirmed yet, but let's be conservative and assume yesterday will be confirmed as a swing low. Connect Points 1 and 4 and extend this line into the future.
Wolfe wave theory suggests we can expect the index to re-bound upwards from Point 4 and hit the extension of the line 1-3. This will be Point 5. At that Point, we should be looking to go short with project target of wherever the index hits the extension of the line 1-4. The market is printing swing highs and lows 5-7 sessions apart, so assuming we hit Point 5 in 6 sessions, on 15/09, at around 5717, we will then turn down and hit line 1-4 at appr. 5000 in a further 6 sessions on appr. 23/09.
See Wolfe Wave Home Page for further details, or Street Smarts (Raschke & Connors).
Geofract
Experienced member
- Messages
- 1,483
- Likes
- 112
Hi Tomorton,
Hello to all the other people contributing to this thread as well!
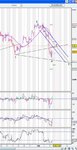
For what it’s worth, I’ve attached a pic explaining my idea of what I think could happen in the near term.
A rebound from point 3, to my projected point 4 on Tuesday – if that occurred I would be looking for indicators to confirm a short at point 4 (probably somewhere around the 5390 mark), with a view to reaching point 5 (approx 5200) by the 15th September.
The thick blue lines represent the channel the FTSE was in, till it dived further down on Thursday. If I am remotely correct, my projections would bring the price nicely back into that channel, before following it down for a further decline.
In terms of WW, I never heard of it before, but I’m quite interested in that, and thanks for the link and idea Tom. Of course I have projected point 4 and 5, which I expect violates the rules of the WW theory. I will have to read up on the WW theory properly before I do any more crystal ball gazing!
Anyway, this chart is just a little bit of fun for me, and shouldn’t be taken too seriously. I certainly wouldn’t be betting on it, not with real money anyway.
Comments welcome.
Ollie
Hello to all the other people contributing to this thread as well!
For what it’s worth, I’ve attached a pic explaining my idea of what I think could happen in the near term.
A rebound from point 3, to my projected point 4 on Tuesday – if that occurred I would be looking for indicators to confirm a short at point 4 (probably somewhere around the 5390 mark), with a view to reaching point 5 (approx 5200) by the 15th September.
The thick blue lines represent the channel the FTSE was in, till it dived further down on Thursday. If I am remotely correct, my projections would bring the price nicely back into that channel, before following it down for a further decline.
In terms of WW, I never heard of it before, but I’m quite interested in that, and thanks for the link and idea Tom. Of course I have projected point 4 and 5, which I expect violates the rules of the WW theory. I will have to read up on the WW theory properly before I do any more crystal ball gazing!
Anyway, this chart is just a little bit of fun for me, and shouldn’t be taken too seriously. I certainly wouldn’t be betting on it, not with real money anyway.
Comments welcome.
Ollie
Attachments
Bladerunner
Guest
- Messages
- 104
- Likes
- 76
Think we have ourselves a classic Bear Squeeze"y ............och !! 🙂
S & P 500 pinbar (day) triggered .......just 🙂
S & P 500 pinbar (day) triggered .......just 🙂
Bladerunner
Guest
- Messages
- 104
- Likes
- 76
Tomorton
you could have the call of all time on your hands here.....
point 5 by the end of the day perhaps 🙂
you could have the call of all time on your hands here.....
point 5 by the end of the day perhaps 🙂
Last edited:
Chelski
Well-known member
- Messages
- 487
- Likes
- 5
Out of the FTSE now - just +126pts net - but wanted to manage exposure as I still have large long position in BP.
LSE must be mega-embarassed about this data feed outage. Today of all days!
Was this from the trade you were going to place above the gap that sat above Fridays open?
barjon
Legendary member
- Messages
- 10,752
- Likes
- 1,863
I work for the company that supplies the infrastructure and systems 😛 oh dear, heads will role...
...or, as they say in the BBC, assistant-heads will roll :cheesy: