You are using an out of date browser. It may not display this or other websites correctly.
You should upgrade or use an alternative browser.
You should upgrade or use an alternative browser.
siavash_83
Newbie
- Messages
- 5
- Likes
- 0
Thinking intra-day, in the UK, watch out for banks and mining firms on Monday. Also look out for US retailers reports. Ill stay aside till 9:00 and will still be favouring a short tomorrow.
See Fins spike on FTSE December book to 7180, when book re-opened Sunday night, 2300hrs. Obviously rogue data feed, not a seeious market quote, but if this triggered anyone's stops or orders, it would be interesting to hear what you are doing about it.
See Fins spike on FTSE December book to 7180, when book re-opened Sunday night, 2300hrs. Obviously rogue data feed, not a seeious market quote, but if this triggered anyone's stops or orders, it would be interesting to hear what you are doing about it.
I've noted that, but I have no positions.
barjon
Legendary member
- Messages
- 10,752
- Likes
- 1,863
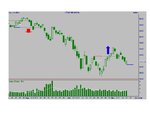
setup for today
Great post, Thank you Barjon.
I am using the 4H and 1H TF to find setups for my swings.
What i can see on my IG chart is that we are in the upper end of a downward channel and on the 1H i can see an entry point for Short at 4360-70 with a 30- 40 point stoploss at 4400
Here is the 4H and 1H chart


the supporting points for the entry is resistance overhead, downward trendline, 50% fib from previous low.
This is what i am watching at the moment.
Great post, Thank you Barjon.
I am using the 4H and 1H TF to find setups for my swings.
What i can see on my IG chart is that we are in the upper end of a downward channel and on the 1H i can see an entry point for Short at 4360-70 with a 30- 40 point stoploss at 4400
Here is the 4H and 1H chart
the supporting points for the entry is resistance overhead, downward trendline, 50% fib from previous low.
This is what i am watching at the moment.
It was a good call Jon. But this market is so volatile right now that just a day and a half's trading counts as a trend! And with ATR way over its own long-term average, the penalties for being on the wrong side are heavy.
I need to be more selective of trades and trade less to get through this. Already trading small small silly small positions, as ATR is so high that quite correctly using the day's opposite extreme of range as a stop can be quite painful.
Going to lick my wounds over the weekend and try to get back in on Monday, there'll possibly be a good shorting opportunity.
Hello all
This looks like a thread that will interest me greatly, as I rather like the idea of trading the swings. i'm also looking to venture on to indices too.
I am currently reading Mark Rivalland's book, which I had considered buying a year or few back, but chose others at the time instead. It was a search on his name that threw up this thread.
Book looks brilliant, especially the swing charts section which he seems to particularly recommend for indices rather than shares, as you probably all know. I do wonder too if it'd be suited to trading FX and maybe various US stocks as well?
May i ask too if you all swing trade a variety of instruments and other indices?
Cheers.
PS For anyone who has been put off in the past by the price of the Rivalland book, there is currently a cheaper edition available on Amazon - about £16 I think I paid. I couldn't look inside and wasn't sure what the difference was apart from the price, so i phoned Harriman House who confirmed that it was a version of the same book but published in India, a cheapo version without the colour pics etc. They also said it was not supposed to be on sale in the UK and recommended i do not buy it. So, who knows, it may vanish if they lodge a complaint, so maybe good idea to hurry up if interested. All the best.
Hi Donkers - Marc Rivalland's book is an excellent manual for swing trading, and I can't think its necessary for a swing trader to have more in formation / tactics at his disposal. That said, I find one of the frustrations inherent in Rivalland swing trading is the number of days that must separate swings. I mean that in a trend you need a swing in the opposite direction to allow you an entry point, and the swing must be at least 3 days long. This is a personal issue and it doesn't make Marc's method any the less practical.
I definitely cannot recommend Alan Farley's Master Swing Trader. The best I can say is that it is 'scholarly', and that's also the worst I can say about it.
Strategically though, money management discipline is absolutely vital to keep you in the game and isn't addressed in Rivalland. See books by Alex Elder.
I find I only need to trade one index, the FTSE100, but as it basically follows the S&P I refer to the S&P whenever chart patterns might be ambiguous on the FTSE. Tracking multiple markets is stressful and time-consuming so I either trade the FTSE or rarely metals but not both simultaneously. There are two nice things about the FTSE - it tracks the US markets, so we can often see by mid-evening here what we will do tomorrow, as New York is closing at that time by the UK clocks. Secondly, the index features real gaps between close and subsequent open - so does the S&P and the Nas I think but many markets, like the Dow, are not permitted to 'gap', while others like FX I think are 24hr markets so real gaps can not occur. Gaps are not essential for swing trading, but they tell you something about market when they occur.
barjon
Legendary member
- Messages
- 10,752
- Likes
- 1,863
For those of you daytrading the ftse swings or for those using the thread's eod method, but looking for a more fine-tuned entry intraday. I offer the following after a bit pf hasty research :cheesy: Be interested if anyone has done a deeper study and if it confirms or denies the quick fire job.
FTSE MOVEMENT
1. The 8am – 8:30 move is likely to reverse; and
2. The 8:30 to 9am move is likely to maintain until 10am when a reversal is about a 50/50 chance.
3. The 10am – 10:30 move is likely to maintain until 11:30 when there is likely to be a reversal which maintains until 12:30
4. The 12:30 to 1pm move has a strong chance of maintaining until at least 2pm
good trading
jon
Interesting points here Jon, thanks - deserves further research. I read up recently on the 30 minute breakout rule, to folow the direction of the breakout after the first 30 minutes, but it was all based on the US markets and not very recent research either, but I am sure its worth following up on the FTSE. If I get round to doing it I will also post here. Cheers.
Interesting points here Jon, thanks - deserves further research. I read up recently on the 30 minute breakout rule, to folow the direction of the breakout after the first 30 minutes, but it was all based on the US markets and not very recent research either, but I am sure its worth following up on the FTSE. If I get round to doing it I will also post here. Cheers.
Hi tom
The 30 minute breakout rule is exactly the strategy i used for SB some years ago, it is one of the more reliable methods i feel for consistent gains, and yes, it works fine on the FTSE as that has always been my market of choice. I waited for a 5 point breakout before getting in.
Steve
Hello Jon -
A little bit more quick research on opening range volatility and using the early reverse.
Looked at FTSE100 over last 6 weeks, taking an opposing position at the close of the first 30-min bar. By opposite I mean simply going long if the close was below the open, short if it was above. In theory, this would have been profitable on 78% of occasions. Using the 60-min bar, exactly same result. So worth a further look I thought.
Had a look then at the SB tick charts and set a 1% target and stop-loss based on 30-min and 60-min bars, then a 2% target and stop based on 30-min and 60-min bars. These charts are the ones that are real-time and represent levels I would have to trade, so are a more accurate assessment of profitability (though taking no account of spreads).
1. 30-min reverse. Take opposite position at close of first 30-min bar. 1% target and stop-loss. W/L = 10/5 (66%)
2. 30-min reverse. Take opposite position at close of first 30-min bar. 2% target and stop-loss. W/L = 11/4 (73%)
3. 60-min reverse. Take opposite position at close of first 60-min bar. 1% target and stop-loss. W/L = 15/7 (68%)
4. 60-min reverse. Take opposite position at close of first 60-min bar. 2% target and stop-loss. W/L = 16/6 (72%)
Worst result was 66% profitability. I can live with being wrong 1 time in 3. Its noticeable that using a wider target and stop, 2%, generated a better success rate in both cases. A wider target and stop also makes the impact of spreads less significant.
Of course, its always nice to think that while I would apply a very strict 2% stop-loss on losers, I would be less precious about hitting the close button on a 2% target on a winner and would let it run beyond a 2% gain. I could even let it run overnight into another session if not trading the Daily Cash book. That's something that will work out better for me in practice rather than in backtesting so that might be icing on the cake.
Nevertheless, I think this is a worthwhile strategy for the next stage, practical testing.
barjon
Legendary member
- Messages
- 10,752
- Likes
- 1,863
Barjon, could you summarize please your strategy with EOD data swinging FTSE please?
I went back to the first posts but just only see charts and setups. Apologies if i just missed it.
Viktor
hw07
it's basically this T2W Day Trading & Forex Community
good trading
jon