You are using an out of date browser. It may not display this or other websites correctly.
You should upgrade or use an alternative browser.
You should upgrade or use an alternative browser.
Sold TXG.to @ 16.12 (time reduced target)
+4.95% (no top-ups, no dividends), held for 120 days = +16% annualized gain
Portfolio = 82% stocks, 18% cash
Portfolio Annual Gains (XIRR) = 28.67%
Stock Market Annual Gains over same period (^SP500TR) = 15.21%
Updated Cumulative PnL chart (5.01 years, zero leverage):

Open Swing Trade Positions:
VGCX.to, CPX.to, WCP.to, FM.to, MTL.to, POU.to, LB.to
VNDA, SSRM, HRL, HP, PII
Buy orders now placed for LB.to (top-up) and AEE
+4.95% (no top-ups, no dividends), held for 120 days = +16% annualized gain
Portfolio = 82% stocks, 18% cash
Portfolio Annual Gains (XIRR) = 28.67%
Stock Market Annual Gains over same period (^SP500TR) = 15.21%
Updated Cumulative PnL chart (5.01 years, zero leverage):
Open Swing Trade Positions:
VGCX.to, CPX.to, WCP.to, FM.to, MTL.to, POU.to, LB.to
VNDA, SSRM, HRL, HP, PII
Buy orders now placed for LB.to (top-up) and AEE
Last edited:
Bought CIVI @ 68.00
Sold small amounts of VNDA, HRL and HP to replenish my USD cash reserves
Bought a tiny bit more CIVI @ 67.64 (top-up)
Portfolio = 85% stocks, 15% cash
Portfolio = 44% CDN market, 56% USA market
Portfolio Annual Gains (XIRR) = 28.84%
Stock Market Annual Gains over same period of time (^SP500TR) = 14.87%
Buy orders now set for LB.to (top-up) and CVI
Last edited:
Bought APA @ 34.31
Portfolio = 90% stocks, 10% cash
Portfolio = 45% CDN market, 55% USA market
Portfolio Annual Gains (XIRR) = 28.55%
Stock Market Annual Gains over same period of time (^SP500TR) = 14.82%
Partial sell order placed for VNDA (to replenish USD cash reserves)
Buy order currently set for LB.to (top-up)
Portfolio = 90% stocks, 10% cash
Portfolio = 45% CDN market, 55% USA market
Portfolio Annual Gains (XIRR) = 28.55%
Stock Market Annual Gains over same period of time (^SP500TR) = 14.82%
Partial sell order placed for VNDA (to replenish USD cash reserves)
Buy order currently set for LB.to (top-up)
Last edited:
Bought a tiny bit more of APA @ 33.39 (top-up) after VNDA partial sell order got filled @ 4.21 (to rebalance my positions/top-up my USDs)
Portfolio = 88% stocks, 12% cash
Portfolio = 45% CDN market, 55% USA market
Portfolio Annual Gains (XIRR) = 28.52%
Stock Market Annual Gains over same period of time (^SP500TR) = 15.11%
Partial sell order now placed for HRL (to rebalance my positions some more)
Buy orders set for LB.to (top-up) and PBF
Last edited:
Hello Burnout,
I came across the link you posted on Reddit that led here. Thank you for sharing and congratulations on your success. I read back through your posts and I appreciate the transparency with which you provide your entries/exits. I am much more of a technical trader than so I find your approach interesting. To be honest, I wish I was a more well rounded trader.
With that said, I wanted to ask you about how you make a final decision on when to enter the market. In one of your previous posts, you mentioned that you "gave up on trying to succeed with any of those kinds of Technical Analysis systems years ago. I'm strictly a bargain shopper now, to put it simply. I only look for *fundamental* reasons for a stock to rise." As I mentioned before, I am a more technical trader and as such, I rely on the technical to point me to the right entry/exit point with the fundamentals as backup for the entry/exit decision. For me, your strategy of finding stocks that will go up is great as long as the price isn't already too high. So, how do you know decide that a given price is a good entry point for your purchase?
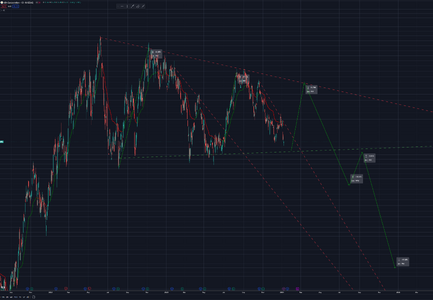
A little backup: The reason behind my question is that (as I mentioned previously) I came across your posts on Friday and your last post mentioned buying APA. I checked out the ticker in on TradingView and drew my funny shapes. I noticed several things. 1. What I saw led me to believe that it still had a little bit to drop before it might pick back up and 2. It let me to believe that it may be primed from further drops based on previous movement.
Disregard the second for a moment as it could be my leanings the "technicals" as opposed to the fundamentals.
My initial chart looked something like this:

On my chart you see several lines. The top descending red line indicates to me that the overall trend of the buying action is waning over time. The bottom horizontal green line tells me that there is pretty consistent support of the price action at the $32 range. The other lines are measurements of total percentage movements as well as what I would expect from this kind of pattern. You can disregard these.
Conslusion #1: My chart leads me to believe that there is still a bit more drop to be had before an upswing. My target would be $31 give or take.
This is not all that important when holding for a longer period of time. However, I will say that $13/share versus $11/share being an 18% increase in profits is significant.
On my second note above, the pattern to me suggests that the overall movement is in a descending triangle. For reference, below is a screenshot of a book that I use entitled "Technical Analysis of the Financial Markets" by John J. Murphy.

Conclusion #2: As I previously mentioned, I notice waning upward price pressure and would expect that, if there is another leg up in the movement, I would need to be weary of a breakout in the down direction. This would obviously be negated if the financials were strong enough to override the market history.
My goal here is to try to learn from someone who has a history of successful trading especially because I feel like your methodology could be very complimentary to mine. While I know you said that you haven't gotten the technicals to work for you, I wonder if there is a way to utilize the technical principals for optimization of price targets.
Eager to hear your thoughts.
I came across the link you posted on Reddit that led here. Thank you for sharing and congratulations on your success. I read back through your posts and I appreciate the transparency with which you provide your entries/exits. I am much more of a technical trader than so I find your approach interesting. To be honest, I wish I was a more well rounded trader.
With that said, I wanted to ask you about how you make a final decision on when to enter the market. In one of your previous posts, you mentioned that you "gave up on trying to succeed with any of those kinds of Technical Analysis systems years ago. I'm strictly a bargain shopper now, to put it simply. I only look for *fundamental* reasons for a stock to rise." As I mentioned before, I am a more technical trader and as such, I rely on the technical to point me to the right entry/exit point with the fundamentals as backup for the entry/exit decision. For me, your strategy of finding stocks that will go up is great as long as the price isn't already too high. So, how do you know decide that a given price is a good entry point for your purchase?
A little backup: The reason behind my question is that (as I mentioned previously) I came across your posts on Friday and your last post mentioned buying APA. I checked out the ticker in on TradingView and drew my funny shapes. I noticed several things. 1. What I saw led me to believe that it still had a little bit to drop before it might pick back up and 2. It let me to believe that it may be primed from further drops based on previous movement.
Disregard the second for a moment as it could be my leanings the "technicals" as opposed to the fundamentals.
My initial chart looked something like this:
On my chart you see several lines. The top descending red line indicates to me that the overall trend of the buying action is waning over time. The bottom horizontal green line tells me that there is pretty consistent support of the price action at the $32 range. The other lines are measurements of total percentage movements as well as what I would expect from this kind of pattern. You can disregard these.
Conslusion #1: My chart leads me to believe that there is still a bit more drop to be had before an upswing. My target would be $31 give or take.
This is not all that important when holding for a longer period of time. However, I will say that $13/share versus $11/share being an 18% increase in profits is significant.
On my second note above, the pattern to me suggests that the overall movement is in a descending triangle. For reference, below is a screenshot of a book that I use entitled "Technical Analysis of the Financial Markets" by John J. Murphy.
Conclusion #2: As I previously mentioned, I notice waning upward price pressure and would expect that, if there is another leg up in the movement, I would need to be weary of a breakout in the down direction. This would obviously be negated if the financials were strong enough to override the market history.
My goal here is to try to learn from someone who has a history of successful trading especially because I feel like your methodology could be very complimentary to mine. While I know you said that you haven't gotten the technicals to work for you, I wonder if there is a way to utilize the technical principals for optimization of price targets.
Eager to hear your thoughts.
Attachments
Well… I don’t believe in TA. Either too subjective or if using hard-coded rules fails to perform adequately, IMO. Also, since this is our only source of income, I just can’t risk trying to make that stuff work anymore. As to how I decide when to enter a trade, that’s easy! Microsoft Excel does all the work for me.
That APA trade was based off my USA dividend paying stock watchlist. This particular watchlist is currently tracking 285 companies to compare its price against. (These are all companies that consistently grow their underlying business valuation – theoretically, if a business’ liquidation value keeps going up, then the stock price *should* also keep going up – this would also negate those previous TA support levels as well, right? Logically, it would stand to reason that only higher lows should be made most of the time for a consistently profitable company – old lows never to be relied upon again for a revisit).
First thing excel does is to determine if this company is undervalued in that watchlist at the moment. Yes, for APA, just barely… The median dividend yield on that watchlist is 2.53%, whereas APA’s yield right now is 2.96%. In a sane world, that *could* be a fundamental reason for the stock price to rise (competition for better dividend returns driving it up).
Then excel compares the % drop the price has sold-off by in X number of weeks/months (parameter setting to fiddle with). I personally look-back quite a few months, whereas Edward O. Thorp used to, successfully, only use a 2 week look-back period for his MUD system – to each their own. The shorter the look-back period = more risk, while a longer one = diminished returns. If the stock with the steepest sell-off on the undervalued half of my list was say -30%, then the buy price of APA would be set at a price that would equal that sell-off percent from its highest price in the look-back period. (The larger the sell-off, hopefully, translates to a bigger portion of that move that was only based off of fear. Which is good. Fear subsides).
Could the price continue dropping off even further? *sigh* Yes. In fact, sadly, most of the time it does after my initial purchase. I’m far more concerned though with trying to keep my portfolio as fully invested as I possibly can as opposed to sitting it out and trying to gauge bottoms. Your TA might get you in at better prices than me, but then again, you’ll probably miss out on a few more stocks than I do and spend more time waiting around in cash… Simply getting a decent discount on the price is good enough for me, as long as a partial recovery from there would be a substantial enough reward to wait it out, that is. For instance, Excel has determined that my initial profit target for APA would be set here:

Looks entirely plausible to me that this target could be achieved in well under a year. I mean, people seem to regularly bid this stock up to that level all the time, right? As of yesterday’s close, that would be more than a 17% gain in price. Annualized, that could be huge, depending on how long it takes to get there, of course…
Downside risk is mitigated by:
The tricky part for me has been trying to fine tune the look-back and price recovery % parameters for this system. It has just been trial and error for the most part as backtesting has not really been feasible due to the evolving nature of my comparison watchlists. (Companies get removed and added from those lists of mine all the time, come every quarter – with a turnover rate around 10% or so, I think).
I’m sure someone could probably make all kinds of improvements here, but really, my goal has just been to “beat the market”, relatively simply and stress-free, whilst I spend my time fishing 😉.
That APA trade was based off my USA dividend paying stock watchlist. This particular watchlist is currently tracking 285 companies to compare its price against. (These are all companies that consistently grow their underlying business valuation – theoretically, if a business’ liquidation value keeps going up, then the stock price *should* also keep going up – this would also negate those previous TA support levels as well, right? Logically, it would stand to reason that only higher lows should be made most of the time for a consistently profitable company – old lows never to be relied upon again for a revisit).
First thing excel does is to determine if this company is undervalued in that watchlist at the moment. Yes, for APA, just barely… The median dividend yield on that watchlist is 2.53%, whereas APA’s yield right now is 2.96%. In a sane world, that *could* be a fundamental reason for the stock price to rise (competition for better dividend returns driving it up).
Then excel compares the % drop the price has sold-off by in X number of weeks/months (parameter setting to fiddle with). I personally look-back quite a few months, whereas Edward O. Thorp used to, successfully, only use a 2 week look-back period for his MUD system – to each their own. The shorter the look-back period = more risk, while a longer one = diminished returns. If the stock with the steepest sell-off on the undervalued half of my list was say -30%, then the buy price of APA would be set at a price that would equal that sell-off percent from its highest price in the look-back period. (The larger the sell-off, hopefully, translates to a bigger portion of that move that was only based off of fear. Which is good. Fear subsides).
Could the price continue dropping off even further? *sigh* Yes. In fact, sadly, most of the time it does after my initial purchase. I’m far more concerned though with trying to keep my portfolio as fully invested as I possibly can as opposed to sitting it out and trying to gauge bottoms. Your TA might get you in at better prices than me, but then again, you’ll probably miss out on a few more stocks than I do and spend more time waiting around in cash… Simply getting a decent discount on the price is good enough for me, as long as a partial recovery from there would be a substantial enough reward to wait it out, that is. For instance, Excel has determined that my initial profit target for APA would be set here:
Looks entirely plausible to me that this target could be achieved in well under a year. I mean, people seem to regularly bid this stock up to that level all the time, right? As of yesterday’s close, that would be more than a 17% gain in price. Annualized, that could be huge, depending on how long it takes to get there, of course…
Downside risk is mitigated by:
- Good underlying financials (its net worth keeps increasing, given enough time, the stock price will as well).
- Undervalued condition – by definition, the price *shouldn’t* be too high to worry about, as is.
- Diversified position sizing.
- No margin usage, so freedom to only sell at a loss when there is strength/rally in the market.
- Averaging down with “top-ups” if my cash pile becomes too big from other recently closed positions.
- Lowering the exit target as time passes.
The tricky part for me has been trying to fine tune the look-back and price recovery % parameters for this system. It has just been trial and error for the most part as backtesting has not really been feasible due to the evolving nature of my comparison watchlists. (Companies get removed and added from those lists of mine all the time, come every quarter – with a turnover rate around 10% or so, I think).
I’m sure someone could probably make all kinds of improvements here, but really, my goal has just been to “beat the market”, relatively simply and stress-free, whilst I spend my time fishing 😉.
Thank you for the thorough response. I totally get it. I don't get enough time with my rods so I can understand your goals.
I'm interested in the MUD method you mentioned. I found the "most up most down" strategy but I'm struggling to see how I would go about setting up my own excel sheet to see the information you are seeing. Can you point me in the right direction?
I'm interested in the MUD method you mentioned. I found the "most up most down" strategy but I'm struggling to see how I would go about setting up my own excel sheet to see the information you are seeing. Can you point me in the right direction?
Man, when I stumbled across that MUD strategy by Mr. Thorp, I was totally blown away! I had thought, up to that point in time, that nobody else was systematically swing trading stocks like I was. You know, strictly on a comparison basis of sell-off percentage. Then I found that. What an absolutely brilliant man! A man of firsts, eh! First to beat blackjack, first to beat the natural 8/9 side-bets in baccarat (which no longer exist now because of him), first to beat roulette (with the first wearable computer), first to solve warrant/option pricing, first to make a market-neutral hedge fund, first to expose the Bernie Madoff fraud. Wow! In his MUD strategy, he pretty much removed ALL the risk by coupling that short-selling element to the trade. A bit too complicated for my simpleton mind to implement though, so instead, I just do longer time frames for my long-only orders to manage the risk/returns. Shame, he never disclosed any of those adjustments/refinements he made for his strategy (he alluded to having to tinker with it a lot in youtube interviews). I mean, that would be the ONLY trading book that I’d ever be interested in snapping up, if it existed.
As to setting up your excel sheet, well, like I said, nobody really approaches stock trading this way – so you’re kind of on your own there. First thing you have to do is to build your watchlist of companies you want to trade (via screening, research, etc). Then you have to manage getting the historical data of those stocks imported to a separate excel sheet that your formulas can refer to. I’m a cheapskate, so I took a free python coding course, then cobbled together the world's ugliest code to fetch the free stock data from Yahoo Finance. If that ever fails me, for whatever reason, then I would probably just buy a subscription service to have this data emailed to me every day from someone like this: https://www.eoddata.com/products/default.aspx
Nowadays, that online, cloud-only, version of excel (excel 365, I think it’s called), has a “stockhistory” function that will automatically import all this data for you, for free. NICE! Google sheets probably has something similar, I don’t know. Personally, I can’t stand all that cloud-only stuff though. And the paranoid side of me would never trust having my financial data stored who-knows-where, possibly accessible to who-knows-who. Plus, there is the matter of internet connection/data always being required to simply just access your files. No thanks. I want to be able to refer to/work on my stuff, even when the net goes on the fritz out here in the boonies.
Finally, the last part would be to actually build the custom table(s) for your tickers, and applying some comparison formulas that refer to your data sheet and crunch the numbers for you. (i.e. xMonthMIN/xMonthMAX/ClosePrice/%fromHigh/SellTarget%ofRange/DividendYield/MedianDividendYldArray/a thousand different “IF” formulas/etc). A fair bit of elbow grease will be needed there, I’m afraid...
Information on his MUD strategy is really scarce. I remember that there were only a couple of articles on the internet (barely just covering the ‘gist of it) and 1 or 2 youtube interviews (where it was touched on only briefly and the interviewer never bothered to grill him for more in-depth details about it). I did find this little tidbit on his website though, where he refers to that strategy as the “omnivore” program instead.
“In August 1992 we launched a new, simpler principal components version. This evolved
into the “omnivore” program, which incorporated additional predictors as they were discovered.
The results: in 10 years, from August 1992 through October 2002, we compounded at 26%
per annum net before our performance fee, 20% net to investors, and made a total of about
$350 million in profit. Some statistics: 10 day average turnover; typically about 200 long and
200 short positions; 10,000 separate bets per year, 100,000 separate bets in 10 years. The gross
expectation per bet at about (2/3)% × 1.5 leverage × 2 sides × 25 turnovers per year is about
50% per year. Commissions and market impact costs reduced this to about 26%.”
In one of the youtube videos I watched, he basically said that he constantly had to keep tweaking it (adding more predictors) to keep it working in changing market conditions. After a while, he said it was no longer “fun” for him, so he opted to shut down the fund instead.
Somebody really should make a movie on his life story while he is still alive so he can fill in some more of those blanks. He’s got to be one of the world's most interesting persons!
skychemist5
Junior member
- Messages
- 10
- Likes
- 3
No thanks. I want to be able to refer to/work on my stuff, even when the net goes on the fritz out here in the boonies.
... just thought I'd let you know, that you can save all that data locally and use it locally as well. You don't have to use it solely in the cloud.
If anyone has a comprehensive spreadsheet they'd be willing to share I'm always looking to upgrade my ratty trade tracking - much thanks in advance!
Sold MTL.to @ 14.73 (time reduced target)
+11.91% (incl. 2 dividends and no top-ups), held for 62 days = +94% annualized gain
Bought FM.to @ 12.24 (top-up)
Portfolio = 83% stocks, 17% cash
Portfolio = 46% CDN market, 54% USA market
Portfolio Annual Gains (XIRR) = 27.86%
Stock Market Annual Gains over same period (^SP500TR) = 15.41%
Updated Cumulative PnL chart (5.10 years, zero leverage):

Quite a lot of dinky little transactions took place that I didn't bother mentioning (hence the long flat section recently). Ie. dividends received, USD to CAD journal trades, interest earned on accts, etc.
Open Swing Trade Positions:
VGCX.to, CPX.to, WCP.to, FM.to, POU.to, LB.to
VNDA, SSRM, HRL, HP, PII, CIVI, APA
Buy orders currently set for LB.to (top-up) and ADM (this sell-off looks way overblown to me for the *possible* accounting irregularities that is scaring everybody right now).
+11.91% (incl. 2 dividends and no top-ups), held for 62 days = +94% annualized gain
Bought FM.to @ 12.24 (top-up)
Portfolio = 83% stocks, 17% cash
Portfolio = 46% CDN market, 54% USA market
Portfolio Annual Gains (XIRR) = 27.86%
Stock Market Annual Gains over same period (^SP500TR) = 15.41%
Updated Cumulative PnL chart (5.10 years, zero leverage):
Quite a lot of dinky little transactions took place that I didn't bother mentioning (hence the long flat section recently). Ie. dividends received, USD to CAD journal trades, interest earned on accts, etc.
Open Swing Trade Positions:
VGCX.to, CPX.to, WCP.to, FM.to, POU.to, LB.to
VNDA, SSRM, HRL, HP, PII, CIVI, APA
Buy orders currently set for LB.to (top-up) and ADM (this sell-off looks way overblown to me for the *possible* accounting irregularities that is scaring everybody right now).
Last edited:
Bought ADM @ 51.91
Portfolio = 85% stocks, 15% cash
Portfolio = 46% CDN market, 54% USA market
Portfolio Annual Gains (XIRR) = 27.93%
Stock Market Annual Gains over same period of time (^SP500TR) = 15.47%
Buy orders set for LB.to (top-up) and ADM (top-up, didn't quite get as much today as I would have liked)
Portfolio = 85% stocks, 15% cash
Portfolio = 46% CDN market, 54% USA market
Portfolio Annual Gains (XIRR) = 27.93%
Stock Market Annual Gains over same period of time (^SP500TR) = 15.47%
Buy orders set for LB.to (top-up) and ADM (top-up, didn't quite get as much today as I would have liked)
Last edited:
Bought a tiny bit more of ADM @ 51.91 (top-up)
Portfolio = 86% stocks, 14% cash
Portfolio = 46% CDN market, 54% USA market
Portfolio Annual Gains (XIRR) = 28.06%
Stock Market Annual Gains over same period of time (^SP500TR) = 15.59%
Partial sell order placed for PII (to top-up USD cash reserves)
Buy order set for LB.to (top-up)
Portfolio = 86% stocks, 14% cash
Portfolio = 46% CDN market, 54% USA market
Portfolio Annual Gains (XIRR) = 28.06%
Stock Market Annual Gains over same period of time (^SP500TR) = 15.59%
Partial sell order placed for PII (to top-up USD cash reserves)
Buy order set for LB.to (top-up)
Last edited:
Partially sold some of my PII, HP and HRL holdings to replenish my USD cash position
Bought ADM @ 51.80 (top-up)
Portfolio = 82% stocks, 18% cash
Portfolio = 46% CDN market, 54% USA market
Portfolio Annual Gains (XIRR) = 28.02%
Stock Market Annual Gains over same period of time (^SP500TR) = 15.57%
Buy orders now set for LB.to (top-up) and VET
Bought ADM @ 51.80 (top-up)
Portfolio = 82% stocks, 18% cash
Portfolio = 46% CDN market, 54% USA market
Portfolio Annual Gains (XIRR) = 28.02%
Stock Market Annual Gains over same period of time (^SP500TR) = 15.57%
Buy orders now set for LB.to (top-up) and VET
Last edited:
Sold HP @ 39.25 (as of today, it is no longer undervalued above that price, IMO)
+12.91% (incl. exchg. rates, no dividends and no top-ups), held for 48 days = 152% annualized gain
Bought SSRM @ 9.48 (top-up)
Portfolio = 74% stocks, 26% cash
Portfolio = 46% CDN market, 54% USA market
Portfolio Annual Gains (XIRR) = 27.98%
Stock Market Annual Gains over same period (^SP500TR) = 15.69%
Updated Cumulative PnL chart (5.12 years, zero leverage):

Open Swing Trade Positions:
VGCX.to, CPX.to, WCP.to, FM.to, POU.to, LB.to
VNDA, SSRM, HRL, PII, CIVI, APA, ADM
Buy orders now set for LB.to (top-up) and APA (top-up)
+12.91% (incl. exchg. rates, no dividends and no top-ups), held for 48 days = 152% annualized gain
Bought SSRM @ 9.48 (top-up)
Portfolio = 74% stocks, 26% cash
Portfolio = 46% CDN market, 54% USA market
Portfolio Annual Gains (XIRR) = 27.98%
Stock Market Annual Gains over same period (^SP500TR) = 15.69%
Updated Cumulative PnL chart (5.12 years, zero leverage):
Open Swing Trade Positions:
VGCX.to, CPX.to, WCP.to, FM.to, POU.to, LB.to
VNDA, SSRM, HRL, PII, CIVI, APA, ADM
Buy orders now set for LB.to (top-up) and APA (top-up)
Last edited:
Bought APA @ 30.67 (top-up)
Portfolio = 75% stocks, 25% cash
Portfolio = 46% CDN market, 54% USA market
Portfolio Annual Gains (XIRR) = 27.63%
Stock Market Annual Gains over same period of time (^SP500TR) = 15.82%
Buy orders set for LB.to (top-up) and VET
Portfolio = 75% stocks, 25% cash
Portfolio = 46% CDN market, 54% USA market
Portfolio Annual Gains (XIRR) = 27.63%
Stock Market Annual Gains over same period of time (^SP500TR) = 15.82%
Buy orders set for LB.to (top-up) and VET
Last edited:
Similar threads
- Replies
- 4
- Views
- 4K
- Replies
- 1
- Views
- 7K
- Replies
- 0
- Views
- 3K
- Replies
- 5
- Views
- 2K