Swing trading FTSE100 members

Sorry for absence, a lot happening this week away from trading. Hope to put up some specimen charts later and tomorrow but unlikely I can do a nightly round-up for quite a while.

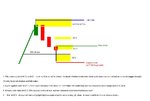
Anyway, China Diapers mentions SAB. This will be of interest from Monday's close onwards if it makes another 'down' day with a lower high and lower low. That will make it three falling sessions in a run since 15/02, and the three-day rule points to Tuesday would be the earliest entry day. This would come if the Monday high is breached (but not the Monday low: if both are breached, the outside bar becomes the putative swing low.). Another up day, with higher high and higher low would extend the retracement required to at least Tuesday, as long as the 15/02 high is intact: but if 2577.5 is breached, the uptrend has already resumed and there is no chance to get in long until after the next 3-day retracement. An inside day on Monday would likewise extend the wait until Tuesday for a putative swing low.

This should be a unanimous long target, as we have seen 2 successively higher swing lows since 25/11 (19/12 and 19/01) helpfully interspersed with successively higher swing highs, 02/12 and 06/01.

I'm purposely ignoring other evidence on SAB, you might look elsewhere for confirmation or otherwise and this could support going long or short or staying flat on this one: plus, as ever, a lot depends on your projected investment time frame.But I will be buying or not according solely to the sequence of EOD highs and lows.

Of course, it's very likely that the markets' positive end to this week will send price up through yesterday's high and the retracement will have been only 2 days, not 3: if so, I will have missed the boat but such is life, there are always other targets.

That's interesting. I am only waiting for two consecutive lower highs so I will be looking to go long Monday.
 
Perish the thought jon, your sage and measured input is always appreciated.

That's a relief, tomo. Thought it'd take much more than me to put you off :LOL:

Since we were talking about AZN earlier it may be worth reflecting on last Wednesday's gap caused by going ex-div - dividend was 123p (that dropped FTSE by 6) but AZN closed 119p down so, in net actuality, was slightly up overall. Serves as a reminder that the chart is not telling the whole story as to a share's strength or otherwise.

You could argue that this is a fatal flaw in the swing analysis, which it is if you are using it as a "predictive" tool. However, if you are using it just to identify points where you are prepared to make an assumption about price direction then it's still valid and a decent method.
 
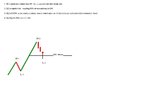
Thought I'd give you a stylised picture of my ideal - not that you're likely to see it more than once a lifetime :)
 

Attachments

  • ideal.JPG
    ideal.JPG
    24.9 KB · Views: 363


That's a relief, tomo. Thought it'd take much more than me to put you off :LOL:

Since we were talking about AZN earlier it may be worth reflecting on last Wednesday's gap caused by going ex-div - dividend was 123p (that dropped FTSE by 6) but AZN closed 119p down so, in net actuality, was slightly up overall. Serves as a reminder that the chart is not telling the whole story as to a share's strength or otherwise.

You could argue that this is a fatal flaw in the swing analysis, which it is if you are using it as a "predictive" tool. However, if you are using it just to identify points where you are prepared to make an assumption about price direction then it's still valid and a decent method.


A flaw it is indeed, though I have abandoned all my younger dreams that TA could predict price. These days I am totally relaxed as to whether Gold is going to go up, or the Euro or supermarkets etc. I have ceased dreaming of inventing a time machine so I could go back to last year and buy stocks that were cheaper then. That is the wrong Holy Grail. The only things we can be sure of are that price in a trend tends to continue in the same direction, but that trends are marked by temporary retracements, offering a direction and a discounted entry point. What more do we need to know?

So, in reality, TA doesn't predict what price will do to us, it predicts what we will do about price.
 
This is pure gold.

Oh good, here's another one then.

Again a somewhat stylised view of my trading sequence since price does have an unfortunate tendency to depart from the ideal route and spend its time exploring highways and byways - as well as leaping straight through various levels on opening.
 

Attachments

  • trading sequence.JPG
    trading sequence.JPG
    44.6 KB · Views: 625
Good managment points jon. Owing to work pressures I have to set-and-forget my market orders and stops but your refinements make perfect sense.
 
Unusually, no putative swing days, either high or low formed today. Charts all showing blue.
 
A wild day but within a very narrow range. I suppose the big boys are as confused as everyone else.

Putative swing lows Diageo and SABMiller. Putative swing high Tesco.
 
A few more putative swing lows signalled yesterday for further long opportunities - Aggreko, Ashmore and International Consolidated Airlines. First two have triggered for me already this am.

Running two portfolios of trades on same entry basis but the Caps trades have trailing stops set, while the Fins trades have a limit order at 1.5 x stop (I'm not moving the stop on these so each Fins trade will simply run until it hits one or other of the original order levels and closes). It's early days yet but the Fins trades are showing a slightly better average return per trade.

All trades opened and run without indicators or reference to main index. Honestly, I would find it difficult to be more selective about the FTSE100 trades even if I had time to pore over them. And as far as direction is concerned, the index remains bullish so what can you do but be long?
 
yeah, it's all go isn't it :)

You must have been in a good few of those you've mentioned, but I've forgotten what you're doing about exits?

I've been mainly going on limit at previous high then waiting for another bite. Closed LLOY today at .37, for example.
 
oh - see you've talked about exits above - must be going senile
 
I suppose the real test of viability for this approach has to be a full round trip - from start of a bullish upleg to its end. Looking at the index chart, the start of the current leg might be signalled by the swing low on 13/01 (though not all members shares will turn around on the same day of course, but it's a useful yardstick). The chart doesn't show a 3-day retracement yet, but when it does, the third 'red' HL bar could be taken to mark the end of this 'cycle'.

An obvious question is why track 100 shares when it's surely easier to trade their parent index? - I am hoping for outperformance that will come from trading the member shares. For instance, the index is up 4.97% since 13/01: of the member shares, 86 are up over the same period, and 58 of these are up more than 4.9%: 27 shares are up more than twice this. The best performer, Vedanta, is up 27%: it would be hard to see the FTSE index rising by a quarter of its value in 28 sessions. I admit that Vedanta didn't print a swing low on 13/01, it had just kept on rising through the FTSE's retracement, and its own next swing low / entry point wasn't until 16/02 - but it has gained in 4 sessions since then what took the FTSE 28.
 
................ I am hoping for outperformance that will come from trading the member shares.............

..and you'll get it, too, but I think you will find that you will have to be choosy. Each share has its own characteristics in the way they move - some suited to the method, some not - and to make matters worse those characteristics do alter over time. EMG and XTA, for example, were beautiful performers during their long rises a couple of years ago, but much more peripatetic lately.

The strategy was born from Gann in the dim and distant, Rivalland has varied it and before him the Floor Trader Method was another variation. I'm sure there are others, too, but I mention these two since what I do now is something of a concoction from both. Many years ago when you had to draw your own charts I did the same thing using point and figure charts.

cheers

jon

ps: Floor Trader Method http://www.trading-naked.com/FloorTraderMethod.htm ignore the opening blurb
 
Of course, I'm hoping to be lazy and unselective, simply letting the poor performers get triggered and stopped quickly and cheaply, selecting themselves out if you like, while the better performers run on. but I must have a look at the FMT, thank you.
 
Surprised myself this pm - closed all the swings.

Happy I banked a chunk of money but troubled that I had not planned this in any sense, so it would be hard to formalise the decision process. Alright, the index daily was looking negative and intra-day the picture was not good. I admit part of the decision was the approach of the month-end (I tally monthly gains) and I prefer these to be positive.
 
Yes, Feb been a good one - nice trends and plenty of nervous retracements, although a lot of fairly shallow ones. Ideal conditions really. Win rate has been sky high, but I've mostly closed on limit so relatively modest bites with only a couple being allowed to run on to greater things. Losses include two false starts which came good later (one taken, one not).

Beware though - it's not that often we get such ideal conditions and a feast of opportunities.
 
Ready to get back in tomorrow depending on how the market goes. Not many opportunities on the charts, too many showing messy and ambiguous patterns.

BAE Systems shows as a possible long if we get above 317.6 and 308.0 holds: HSBC is similar, though the swing day may be shown to be yesterday if 578.55 is broken and 547 holds. Tullow Oil looks good. International Consolidated Airlines triggered a rather messy long today, though I didn't have this as an entry order.
 
Top