swing trading a live account

special4x

Member
Messages
87
Likes
0
I would like to share with other T2W members the way I trade the 'beasts' of the forex world that many retail traders would not consider a viable trading proposition.

I am playing the longer game here: with trades taking days to set up, and many more day to play out.

Take this GBP/NZD chart I've been watching since 8th. May.

Sorry, I'm having trouble uploading attachment.

C:\Documents and Settings\User\My Documents\My Pictures\gbp-nzd.gif

We have plenty of time, so there's no need to rush.
I'll be back in a few days.
 

Attachments

  • gbp-nzd.gif
    gbp-nzd.gif
    65.1 KB · Views: 302
Last edited:
Just observing price action and considering the possibilities. I love to see the pips squeezed till their eyes water. The longer and tighter the squeeze, the more pips may be forthcoming. We have also reached the six-month high - which might be significant.
This is typical carry-trade behaviour, with the big players bowling googlies to squeeze the price to the limit, knowing the fall will be big - and the positive swap on shorting this cross, a nice juicy bonus.
Possible pip count I would expect? Well: I would be disappointed with only two zeros No guarantee though. :whistling


gbp-nzd2.gif
 
We have been watching the GBP/NZD for 10 days now, and it seems there could be an I/D and a black arrow forming. Fundamentals are muddying the waters a little, but if we remain patient there will be a good trade to be had.


gbp-nzd4.gif
 
Since the price closed inside the EDTZ on the 14th. May, it has kept within a 450 pip trading range for 9? days. This is really good to see, and I would like this consolidation to continue through next week: furthermore, the PSAR action at the moment lends itself to this possibilty.

So, I want...
this range to continue for a few more days...
a black zig-zag arrow to hold...
a yellow arrow to support...
a solid break and close below the green channel...
price to move down through the lower EDTZ line...
retest the green channel and/or the EDTZ line...
a three bar reversal pattern would be nice...
as would a divergence.
Then it's Fibonacci time. I use an impulse/corrective wave system to maximise profits, whichever system I am using.


I agree it looks like a lot of quacks to line up, but it's fairly straightforward really.


gbp-nzd5.gif
 
Update:
I've added a third tramline today which gives me a clearer picture of the current price action. If the d/ward move continues I believe a yellow arrow will form at the EOD. This is an aggressive short entry point, and not what I'm looking for.
The chart below roughly outlines the trade I would like to see develop over the next two/three weeks.
We all "read" charts in different ways, of course, but I'm prepared to go out on a limb and give my opinion on what I expect to be a low-risk, highly profitable trade.


gbp-nzd6.gif
 
A yellow arrow did form at EOD, and an aggressive short entry is available.
The impulsive wave and retracement that I mentioned yesterday, will of course, be as long as they will be, but I would like it to happen in as few bars as possible.
Eight of the trading entry "conditions" from post #5 have now been met.

this range to continue for a few more days...
a black zig-zag arrow to hold...
a yellow arrow to support...
a solid break and close below the green channel...
price to move down through the lower DTZ line...
retest the green channel and/or the DTZ line...
a three bar reversal pattern would be nice...
as would a divergence.


At the moment, I'm very happy with the way this trade is developing.


gbp-nzd6.gif
 
Last edited:
The last shorting opportunity on this pair was last Nov/Dec/Jan. As you can see it took 16 days to set up and produced 1500 pips during its 30 day run. This was a very conservative entry with low risk and low stress. You will also notice that in this instance the draw-down was less than 100 pips.
I trade this system on a micro account only, which means even less stress, and only in the direction of positive rollover interest.
I am now waiting for a retacement back to the trading channel.


gbp-nzd6.gif
 
I have been watching this trade play out since May 8th. There was an aggressive trade entry possible on May 25th., (which as it happens would have produced 850 pips to date) but it was refused in this instance because I am trying to show a more conservative, low-risk, low-stress way of trading the big moves: and that means trading off the retracement.
It cannot be known how long the impulse wave will be: or if it is, indeed, a corrective wave of the previous up move. Time, and the charts, will show the me way.
The latest white arrow would mean a continuation of the cuurent down trend.


gbp-nzd9.gif
 
Day 35

As we know; sometimes trades set up quickly, and others take their own sweet time. This is definitely one of the latter.

gbp-nzd11.gif
Looking at the price chart, the confluence of signals can clearly be seen along with the divergent signal below. So lets see if the corrective wave meets the requirements of the system, i.e. a pull back to the Fib trading channel.


gbp-nzd10.gif
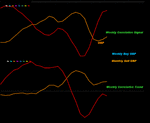
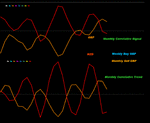
The weekly correlation shows there may be room for a promising bear rally, whilst the monthy shows a continuation of the down trend.

gbp-nzd12.gif
Monthly correlation.
 
Last edited:
Top