You are using an out of date browser. It may not display this or other websites correctly.
You should upgrade or use an alternative browser.
You should upgrade or use an alternative browser.
Best Thread Support & Resistance Explained
- Thread starter DionysusToast
- Start date
- Watchers 20
Prawnsandwich
Well-known member
- Messages
- 339
- Likes
- 30
re: Support & Resistance Explained
Steady on Chartsy...
all dis arguin', gets me hot n' bovvurd
Steady on Chartsy...
Scotty2Cues
Established member
- Messages
- 737
- Likes
- 33
re: Support & Resistance Explained
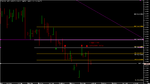
You dont think these are due to the speculators watching the levels?
Right, well find us some of said people who move the market please talking about the line they're looking at on a chart 😆
You dont think these are due to the speculators watching the levels?
Attachments
Scotty2Cues
Established member
- Messages
- 737
- Likes
- 33
Shakone
Senior member
- Messages
- 2,460
- Likes
- 665
re: Support & Resistance Explained
It seems the discussion has moved to whether anyone who is big enough to move markets has a horizontal line in mind.
Soros DID have a horizontal line in mind when he bet against the pound. He had a very specific level in mind, he also had fundamentals in his mind, and various other things and bet that the level wouldn't hold. So did a lot of big players around that time if you've read market wizards. Lets not be ridiculous and pretend they were oblivious to the level the Bank of England were trying to hold. Central banks can have levels they want the rate above or below. We've seen that this year.
In fact anyone who is in the market, should have at least some of the horizontal levels of where their average price is, where their stop is located, and where their target is, where they would like to see price break through to stay in etc
barjon
Legendary member
- Messages
- 10,752
- Likes
- 1,863
re: Support & Resistance Explained
The following scenario is pure supposition on my part and it'd be good if someone in the business could say if it's wildly off the mark.
Shares in ABCplc are standing at £10. A fund manager of a decent sized fund wants a substantial position in ABCplc around this price but is not keen to pay more than £11. He puts his very large order to you, his broker, and you know that your head will be on the block if you can't get it filled within the limit he has set and at or below VWAP. So what do you do? Presumably, in broad terms: snatch all you can around £10 whilst trying to disguise the fact that you're an active buyer. Then, although you might be taking lots below VWAP on the way, you stop buying at £11 and maybe stick in some eye-catching sell orders above the price to dissuade buyers. If your tactics have worked and the price does fall back then you'll be buying some a bit below VWAP on the way back and again start snatching all you can get if £10 comes again. And so on until you have filled the line.
So, unless this scenario is a total load of cobblers, a chartist is going to see and draw S/R lines on a chart which have validity for as long as you are engaging in this activity (and therein lies the rub 🙂).
jon
Prawnsandwich
Well-known member
- Messages
- 339
- Likes
- 30
re: Support & Resistance Explained
Thats an interesting scenario, and I can see the point made to an large extent.....
But you also have S/R levels with multiple touches over longer time frames of weeks, months, years etc....
The following scenario is pure supposition on my part and it'd be good if someone in the business could say if it's wildly off the mark.
Shares in ABCplc are standing at £10. A fund manager of a decent sized fund wants a substantial position in ABCplc around this price but is not keen to pay more than £11. He puts his very large order to you, his broker, and you know that your head will be on the block if you can't get it filled within the limit he has set and at or below VWAP. So what do you do? Presumably, in broad terms: snatch all you can around £10 whilst trying to disguise the fact that you're an active buyer. Then, although you might be taking lots below VWAP on the way, you stop buying at £11 and maybe stick in some eye-catching sell orders above the price to dissuade buyers. If your tactics have worked and the price does fall back then you'll be buying some a bit below VWAP on the way back and again start snatching all you can get if £10 comes again. And so on until you have filled the line.
So, unless this scenario is a total load of cobblers, a chartist is going to see and draw S/R lines on a chart which have validity for as long as you are engaging in this activity (and therein lies the rub 🙂).
jon
Thats an interesting scenario, and I can see the point made to an large extent.....
But you also have S/R levels with multiple touches over longer time frames of weeks, months, years etc....
robster970
Guest Author
- Messages
- 4,567
- Likes
- 1,390
re: Support & Resistance Explained
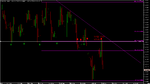
I'm quite interested in that graph scotty. Firstly I suspect that the computational method used by the program to emulate a coin flip would be pseudo-random so over what's a statistically significant sample size, I wonder whether you have S generated (rather than R) as a consequence of a bias in the machine used to calculate it? For a random process over that sample size, I think you should see both quite clearly.
Secondly, if it truly was random walk, you are going to end up showing S and R develop at the extremes of probability based upon a Gaussian distribution. Doesn't this just show 'value' areas for a reversion to mean strategy?
Don't you think this just shows value trading which is essentially what S&R are? The only difference is that one is value based upon statistical behaviour using a Gaussian curve, the other is human perceived value which is somewhat less Gaussian.
Also if markets really are random walk, S&R would be equidistant and most of the time, they're not.
I don't think this graph proves or disproves anything. It is interesting though.
But there is also "S&R" on the random chart below. So I suppose its about distinguishing the levels that are being studied and are due to group behaviour to those that are random
I'm quite interested in that graph scotty. Firstly I suspect that the computational method used by the program to emulate a coin flip would be pseudo-random so over what's a statistically significant sample size, I wonder whether you have S generated (rather than R) as a consequence of a bias in the machine used to calculate it? For a random process over that sample size, I think you should see both quite clearly.
Secondly, if it truly was random walk, you are going to end up showing S and R develop at the extremes of probability based upon a Gaussian distribution. Doesn't this just show 'value' areas for a reversion to mean strategy?
Don't you think this just shows value trading which is essentially what S&R are? The only difference is that one is value based upon statistical behaviour using a Gaussian curve, the other is human perceived value which is somewhat less Gaussian.
Also if markets really are random walk, S&R would be equidistant and most of the time, they're not.
I don't think this graph proves or disproves anything. It is interesting though.
Last edited:
Shakone
Senior member
- Messages
- 2,460
- Likes
- 665
re: Support & Resistance Explained
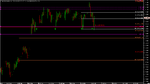
On Scotty2Cues random walk chart:
Support and Resistance levels should not be assumed to work or not because the chart appears as if it worked after the fact. If you want to test if something is relevant as support or resistance, you mark it ahead of time, then simulate into the future and observe whether price reacts there. Then you do this plenty of times and get an idea of how often it works or doesn't. Apply the same method to your random chart. Do you think if you draw a low on your chart you can expect it to hold as support when you simulate further, that it will bounce within a point of the line? Or when it does break through, price will come back and support will become resistance, again within a point or two?
DionysusToast
Legendary member
- Messages
- 5,965
- Likes
- 1,501
re: Support & Resistance Explained
Interesting BUT it's not really based on experience or research. It's just stuff you made up.
I am not sure what to say to be honest. Perhaps it's only order book scalpers that have a definitive view of when this stuff will work or not.
I got a PM from Arabian about something I showed him, he thought it related to spreading on a different set of markets . I don't play in markets where spreading occurs. I don't really understand it other than in very simple terms but it is clear that in those markets, the way you read order flow is different to index futures. The way you'd read whether a level would hold or not is slightly different I presume too.
It seems where we are in terms of explaining S&R. outside of the short term on index futures is as follows:
1 - It works and sometimes it doesn't.
2 - Everything you need to know is on the chart.
3 - Nothing outside of the chart will help.
4 - Stuff like price clustering because of real-world events is not important or not important enough to discuss.
Shurely some mishtake...
The following scenario is pure supposition on my part and it'd be good if someone in the business could say if it's wildly off the mark.
Shares in ABCplc are standing at £10. A fund manager of a decent sized fund wants a substantial position in ABCplc around this price but is not keen to pay more than £11. He puts his very large order to you, his broker, and you know that your head will be on the block if you can't get it filled within the limit he has set and at or below VWAP. So what do you do? Presumably, in broad terms: snatch all you can around £10 whilst trying to disguise the fact that you're an active buyer. Then, although you might be taking lots below VWAP on the way, you stop buying at £11 and maybe stick in some eye-catching sell orders above the price to dissuade buyers. If your tactics have worked and the price does fall back then you'll be buying some a bit below VWAP on the way back and again start snatching all you can get if £10 comes again. And so on until you have filled the line.
So, unless this scenario is a total load of cobblers, a chartist is going to see and draw S/R lines on a chart which have validity for as long as you are engaging in this activity (and therein lies the rub 🙂).
jon
Interesting BUT it's not really based on experience or research. It's just stuff you made up.
I am not sure what to say to be honest. Perhaps it's only order book scalpers that have a definitive view of when this stuff will work or not.
I got a PM from Arabian about something I showed him, he thought it related to spreading on a different set of markets . I don't play in markets where spreading occurs. I don't really understand it other than in very simple terms but it is clear that in those markets, the way you read order flow is different to index futures. The way you'd read whether a level would hold or not is slightly different I presume too.
It seems where we are in terms of explaining S&R. outside of the short term on index futures is as follows:
1 - It works and sometimes it doesn't.
2 - Everything you need to know is on the chart.
3 - Nothing outside of the chart will help.
4 - Stuff like price clustering because of real-world events is not important or not important enough to discuss.
Shurely some mishtake...
Shakone
Senior member
- Messages
- 2,460
- Likes
- 665
re: Support & Resistance Explained
You are being a bit harsh here Dionysus. No matter how good you are at reading order flow, when it comes to a level, sometimes it works and sometimes it doesn't. Period. For you, for me, for everyone. Even if your reading of the tape is incredible, and gives you a 95% chance of being correct about whether it holds or not, there is always the chance some big player can scupper your plans, or some news breaks and you're in the 5% wrong.
So once you accept that it sometimes works, and sometimes doesn't, you look for ways to make you correct more often. BBMac, picks a level that he believes will hold. He looks for confluence with fibs or trendlines to make that a more important level. He also looks at what price is doing around the level, and if all those factors are in place, he trades it.
Please stop trying to pretend that you are doing anything different. Dionysus, picks a level that he thinks may hold. He then waits for price to get there, and looks for confluence with DOM (or input whatever else you use) and then he trades it. Same process, just different idea of confluence between you and BBMac.
So in your 1,2,3,4. Well 1) everyone faces, no matter how they trade. No certainties in this business. 2) Rather than say everything you need to know is on the chart, I'd prefer it as "just using the charts, there is enough to make good profits". Lots of things outside the charts can help us so 2) and 3) is certainly not something I'd agree with. Just knowing when NFP is, can help us.
robster970
Guest Author
- Messages
- 4,567
- Likes
- 1,390
re: Support & Resistance Explained
It's not comparable Shakone - scotty's chart shows the extremes of probability of consecutive coinflips - it's not a like for like comparisson.
On Scotty2Cues random walk chart:
Support and Resistance levels should not be assumed to work or not because the chart appears as if it worked after the fact. If you want to test if something is relevant as support or resistance, you mark it ahead of time, then simulate into the future and observe whether price reacts there. Then you do this plenty of times and get an idea of how often it works or doesn't. Apply the same method to your random chart. Do you think if you draw a low on your chart you can expect it to hold as support when you simulate further, that it will bounce within a point of the line? Or when it does break through, price will come back and support will become resistance, again within a point or two?
It's not comparable Shakone - scotty's chart shows the extremes of probability of consecutive coinflips - it's not a like for like comparisson.
robster970
Guest Author
- Messages
- 4,567
- Likes
- 1,390
re: Support & Resistance Explained
Yep - I maintain it's tied up with areas of liquidity but everybody got all chartist and technical. I can see why you think it's about orderflow too - as that represents level of liquidity at certain prices.
The big boys are looking for liquidity to load or offload. It's the big boys that cause reversals.
Anyway, that's what I reckon and in my tiny mind, it works for me.
Shurely some mishtake...
Yep - I maintain it's tied up with areas of liquidity but everybody got all chartist and technical. I can see why you think it's about orderflow too - as that represents level of liquidity at certain prices.
The big boys are looking for liquidity to load or offload. It's the big boys that cause reversals.
Anyway, that's what I reckon and in my tiny mind, it works for me.
DionysusToast
Legendary member
- Messages
- 5,965
- Likes
- 1,501
re: Support & Resistance Explained
There is a difference and it is massive.
As I have stated, there are times on stocks where price will gravitate to a level for reasons outside of the chart or any concept of value. Buyouts and options expirations create are such areas. In this case, when price reaches that area again, you can look for all of the confluence you like, the reason for failure of resistance will be the fact that the resistance was created under unusual circumstances. Do such nuances not exist in other markets/timeframes ?
Confluence basically means that you have many indicators based on the same underlying data set giving a signal. What I am discussing is looking outside of that single data set. Confluence is absolutely unavoidable when you apply various mathematical models to a single data set.
The only point about the things I explained is that each market is different and I stated how it worked in a few markets as an example for others to do the same.
We still come back to the point that many people are saying that all markets are the same, all timeframes are the same and a single analysis technique can be used to trade them all.
I can buy this to some extent if people can give some solid reasons as to why people are trading at those levels for that market in that timeframe. Thus far, there has been very little discussion to that end.
So - I am not saying it can't work. What I am saying is that the various people here may be able to shed some light on why it works in their market, what the drivers are and who the players are.
Surely this level of knowledge should be a minimum when putting your money on the line.
As for ""just using the charts, there is enough to make good profits" - this implies a level of laziness and lack of inquisitiveness. You could do 50 chart based trades a week yet always have a loser on Thursday morning. In this case, you could either just ride with it OR you could look at what's happening on a Thursday to cause those losses.
Anyway - I do have an open mind when it comes to discussing why stuff works but the answers to that are not in the charts.
You are being a bit harsh here Dionysus. No matter how good you are at reading order flow, when it comes to a level, sometimes it works and sometimes it doesn't. Period. For you, for me, for everyone. Even if your reading of the tape is incredible, and gives you a 95% chance of being correct about whether it holds or not, there is always the chance some big player can scupper your plans, or some news breaks and you're in the 5% wrong.
So once you accept that it sometimes works, and sometimes doesn't, you look for ways to make you correct more often. BBMac, picks a level that he believes will hold. He looks for confluence with fibs or trendlines to make that a more important level. He also looks at what price is doing around the level, and if all those factors are in place, he trades it.
Please stop trying to pretend that you are doing anything different. Dionysus, picks a level that he thinks may hold. He then waits for price to get there, and looks for confluence with DOM (or input whatever else you use) and then he trades it. Same process, just different idea of confluence between you and BBMac.
So in your 1,2,3,4. Well 1) everyone faces, no matter how they trade. No certainties in this business. 2) Rather than say everything you need to know is on the chart, I'd prefer it as "just using the charts, there is enough to make good profits". Lots of things outside the charts can help us so 2) and 3) is certainly not something I'd agree with. Just knowing when NFP is, can help us.
There is a difference and it is massive.
As I have stated, there are times on stocks where price will gravitate to a level for reasons outside of the chart or any concept of value. Buyouts and options expirations create are such areas. In this case, when price reaches that area again, you can look for all of the confluence you like, the reason for failure of resistance will be the fact that the resistance was created under unusual circumstances. Do such nuances not exist in other markets/timeframes ?
Confluence basically means that you have many indicators based on the same underlying data set giving a signal. What I am discussing is looking outside of that single data set. Confluence is absolutely unavoidable when you apply various mathematical models to a single data set.
The only point about the things I explained is that each market is different and I stated how it worked in a few markets as an example for others to do the same.
We still come back to the point that many people are saying that all markets are the same, all timeframes are the same and a single analysis technique can be used to trade them all.
I can buy this to some extent if people can give some solid reasons as to why people are trading at those levels for that market in that timeframe. Thus far, there has been very little discussion to that end.
So - I am not saying it can't work. What I am saying is that the various people here may be able to shed some light on why it works in their market, what the drivers are and who the players are.
Surely this level of knowledge should be a minimum when putting your money on the line.
As for ""just using the charts, there is enough to make good profits" - this implies a level of laziness and lack of inquisitiveness. You could do 50 chart based trades a week yet always have a loser on Thursday morning. In this case, you could either just ride with it OR you could look at what's happening on a Thursday to cause those losses.
Anyway - I do have an open mind when it comes to discussing why stuff works but the answers to that are not in the charts.
Last edited:
Shakone
Senior member
- Messages
- 2,460
- Likes
- 665
re: Support & Resistance Explained
And of course I am very interested in your methods, but you were listing 1),2),3),4) as if that were a summary of opinion. And none of the 1-4 is something I agree with. It is not that everything you need to know to be the best possible trader is in the charts. It is that there is ENOUGH in the charts alone to be a profitable trader. And since that is the first goal for anyone (to be profitable), then that is one of the first things I'd recommend learning.
Also you are again making a disrtinction about things being in the same data set. People can trade from charts and have different data sets. Just as people can trade off charts with DOM and have different data sets. And anyway, confluence doesn't mean what you stated. It is simply a flowing together of several things in the same direction. They can be from the same data set or different.
Not quite. Instruments are different and have their own nuances. But the general behaviour of most, is the same (major currencies, indices, oil etc. in this statement). Nuances different, general behaviour the same. The same is true of timeframes. Different nuances for sure, but most have similar behaviour. Can I see trends on daily and 5 minute? Yes, and if you remove scale they look quite similar. Can I see support become resistance on daily and 5 min? Again yes. Can I see 'crashes'? Yes they occur quite frequently on the smaller timeframes. If your method doesn't work on several markets, then I would be wary of it.We still come back to the point that many people are saying that all markets are the same, all timeframes are the same and a single analysis technique can be used to trade them all.
No it doesn't at all, you're reading what you want to. If it had finished with "..make good profits...and so then there is no need to look into anything else" then you would be correct. It doesn't say that at all. It is enough to get by in America with English and Spanish. It would be great of course if I could speak English, Spanish, Italian, Chinese etc. but if you wanted to get by there, the two most useful languages would be English and Spanish (Money management and Reading Price). Of course I always want to improve. But I am not going to attempt to learn a dozen languages before I can speak one fluently, and then two fluently and then three and so on.As for ""just using the charts, there is enough to make good profits" - this implies a level of laziness and lack of inquisitiveness.
And of course I am very interested in your methods, but you were listing 1),2),3),4) as if that were a summary of opinion. And none of the 1-4 is something I agree with. It is not that everything you need to know to be the best possible trader is in the charts. It is that there is ENOUGH in the charts alone to be a profitable trader. And since that is the first goal for anyone (to be profitable), then that is one of the first things I'd recommend learning.
Also you are again making a disrtinction about things being in the same data set. People can trade from charts and have different data sets. Just as people can trade off charts with DOM and have different data sets. And anyway, confluence doesn't mean what you stated. It is simply a flowing together of several things in the same direction. They can be from the same data set or different.
Last edited:
DionysusToast
Legendary member
- Messages
- 5,965
- Likes
- 1,501
re: Support & Resistance Explained
This is an interesting comment. Using any single TA technique in isolation will give you a 50% win rate if your stops and targets are equal.
Now you say that a method that uses charts plus additional information and yields a 95% hit rate is effectively the same because "sometimes it works, sometimes it doesn't".
In my opinion - this is a very odd way of thinking.
The difference is in where you look. Let's say the chart gives you a 50% chance just looking at S/R.
As I mentioned before, there are certain events that will cause price clustering which in appearance looks very similar to S/R. It does not matter how much you look at a chart, this will not be visible.
I guess there must be a new class of profitable trader out there.
If you told me that there was a piece of information out there (technical or fundamental) that would see my current method yield 5% more winners, there is no way on earth I'd say "I make good profits with what I use, no thanks". I would first mull over whether it was worth looking at, does it sound reasonable? I would then see if it was something I could apply with the time I have available. I would then endeavour to see if it did add something.
Mostly though, from what I have seen in the traders I know, they review their winners & losers and use that as the basis to evolve. I have yet to meet someone that says, I will do anything to improve my trading, as long as it only involves looking at a chart.
You are being a bit harsh here Dionysus. No matter how good you are at reading order flow, when it comes to a level, sometimes it works and sometimes it doesn't. Period. For you, for me, for everyone. Even if your reading of the tape is incredible, and gives you a 95% chance of being correct about whether it holds or not, there is always the chance some big player can scupper your plans, or some news breaks and you're in the 5% wrong.
This is an interesting comment. Using any single TA technique in isolation will give you a 50% win rate if your stops and targets are equal.
Now you say that a method that uses charts plus additional information and yields a 95% hit rate is effectively the same because "sometimes it works, sometimes it doesn't".
In my opinion - this is a very odd way of thinking.
So once you accept that it sometimes works, and sometimes doesn't, you look for ways to make you correct more often. BBMac, picks a level that he believes will hold. He looks for confluence with fibs or trendlines to make that a more important level. He also looks at what price is doing around the level, and if all those factors are in place, he trades it.
Please stop trying to pretend that you are doing anything different. Dionysus, picks a level that he thinks may hold. He then waits for price to get there, and looks for confluence with DOM (or input whatever else you use) and then he trades it. Same process, just different idea of confluence between you and BBMac.
The difference is in where you look. Let's say the chart gives you a 50% chance just looking at S/R.
As I mentioned before, there are certain events that will cause price clustering which in appearance looks very similar to S/R. It does not matter how much you look at a chart, this will not be visible.
So in your 1,2,3,4. Well 1) everyone faces, no matter how they trade. No certainties in this business. 2) Rather than say everything you need to know is on the chart, I'd prefer it as "just using the charts, there is enough to make good profits". Lots of things outside the charts can help us so 2) and 3) is certainly not something I'd agree with. Just knowing when NFP is, can help us.
I guess there must be a new class of profitable trader out there.
If you told me that there was a piece of information out there (technical or fundamental) that would see my current method yield 5% more winners, there is no way on earth I'd say "I make good profits with what I use, no thanks". I would first mull over whether it was worth looking at, does it sound reasonable? I would then see if it was something I could apply with the time I have available. I would then endeavour to see if it did add something.
Mostly though, from what I have seen in the traders I know, they review their winners & losers and use that as the basis to evolve. I have yet to meet someone that says, I will do anything to improve my trading, as long as it only involves looking at a chart.
DionysusToast
Legendary member
- Messages
- 5,965
- Likes
- 1,501
re: Support & Resistance Explained
OK - now I see the difference in perspective.
When I talk of behaviour, you are applying your perspective to that term and I have not really explained mine. To you behaviour is candlesticks, trendlines, horizontal lines etc. Of course, when you time splice price action and put it on a chart, then look for patterns, you will see patterns recur. If you are looking for very specific pre-defined patterns, you might overlook the bigger picture
To me 'behaviour' is quite a different beast indeed. If you look at the intraday movements on the ES and the BUND, they behave very differently. The ES tends to make a range and then test both ends of that range, it tends to break new highs & lows and then reverse back to the other end. These are the easiest days to trade the ES when the range is large. When the ES moves up gradually, it tends to get into a ryhthm, 2 up 1 down, 2.25 up 1.75 down, 2.5 up , 1.5 down etc, quite often the time it takes to make these swings is similar 2-5 minutes.
The BUND is very different, it doesn't have such predictable swings, it'll meander around and the suddenly zoom off in one direction for a prolonger period. I find it quite hard to handle.
2 different instruments & totally different behaviour, if your perspective on behaviour is unfettered by the need for behaviour to fit into trendlines, candles, fibs, macds etc. etc.
In terms of the different sets of data used. I am presuming charts are all because thus far, no-one has descibed a different market/timeframe and presented the non-chart data used.
Not quite. Instruments are different and have their own nuances. But the general behaviour of most, is the same (major currencies, indices, oil etc. in this statement). Nuances different, general behaviour the same. The same is true of timeframes. Different nuances for sure, but most have similar behaviour. Can I see trends on daily and 5 minute? Yes, and if you remove scale they look quite similar. Can I see support become resistance on daily and 5 min? Again yes. Can I see 'crashes'? Yes they occur quite frequently on the smaller timeframes. If your method doesn't work on several markets, then I would be wary of it.
OK - now I see the difference in perspective.
When I talk of behaviour, you are applying your perspective to that term and I have not really explained mine. To you behaviour is candlesticks, trendlines, horizontal lines etc. Of course, when you time splice price action and put it on a chart, then look for patterns, you will see patterns recur. If you are looking for very specific pre-defined patterns, you might overlook the bigger picture
To me 'behaviour' is quite a different beast indeed. If you look at the intraday movements on the ES and the BUND, they behave very differently. The ES tends to make a range and then test both ends of that range, it tends to break new highs & lows and then reverse back to the other end. These are the easiest days to trade the ES when the range is large. When the ES moves up gradually, it tends to get into a ryhthm, 2 up 1 down, 2.25 up 1.75 down, 2.5 up , 1.5 down etc, quite often the time it takes to make these swings is similar 2-5 minutes.
The BUND is very different, it doesn't have such predictable swings, it'll meander around and the suddenly zoom off in one direction for a prolonger period. I find it quite hard to handle.
2 different instruments & totally different behaviour, if your perspective on behaviour is unfettered by the need for behaviour to fit into trendlines, candles, fibs, macds etc. etc.
In terms of the different sets of data used. I am presuming charts are all because thus far, no-one has descibed a different market/timeframe and presented the non-chart data used.
Shakone
Senior member
- Messages
- 2,460
- Likes
- 665
re: Support & Resistance Explained
Did I say it is "the same"? Did I say 50% is the same as 95%? Or was my point that no matter what the % is, there are no guarantees. So everything "sometimes works and sometimes doesn't". So given that everything sometimes works and sometimes doesn't, then we do our best to maximise the chance of it working. I believe I said this when I wrote "you look for ways to make you correct more often", but you chose to ignore that and place your own words in my post and imply that I don't care whether I win 50% of the time or 95% of the time, lol. One of the methods to improve chances is confluence in my opinion. That does not have to be chart only confluence. If you think the fundamentals suggest and upward move, and you think support will hold, and there is a trendline, and long term/short term trend is up, and the COT report suggests it will go up, and you see something in depth of market, and you're reading the volume and there is some candlestick price action to suggest it is going up etc etc, then this is a trade based on confluence. What are you doing that is outside of this? Or are you just using confluence of different things, some of them not in the chart? Nothing wrong with that, but I just don't see a difference. If it is more successful then good for you. Maybe I'll do something similar one day.
Now, in future, if you want to make up what people are writing so you can argue with it, please create another account and argue with yourself. Because it is tiring to have to explain myself, simply because you're either lacking in comprehension, or you've already made up your mind what you want to argue with, and so you see that in my posts even when it isn't there.
What is it you want from the thread now?
You're doing it again. Not reading properly. Take your time and read what is written, and understand it. Don't think that it is saying something more than is written, I write what I mean, not more. You're wrong about the 50%, that's a ridiculous statement if you think about it. Why on earth would every single price point have a 50% chance of going up as well as down? But put that aside.This is an interesting comment. Using any single TA technique in isolation will give you a 50% win rate if your stops and targets are equal.
Now you say that a method that uses charts plus additional information and yields a 95% hit rate is effectively the same because "sometimes it works, sometimes it doesn't".
Did I say it is "the same"? Did I say 50% is the same as 95%? Or was my point that no matter what the % is, there are no guarantees. So everything "sometimes works and sometimes doesn't". So given that everything sometimes works and sometimes doesn't, then we do our best to maximise the chance of it working. I believe I said this when I wrote "you look for ways to make you correct more often", but you chose to ignore that and place your own words in my post and imply that I don't care whether I win 50% of the time or 95% of the time, lol. One of the methods to improve chances is confluence in my opinion. That does not have to be chart only confluence. If you think the fundamentals suggest and upward move, and you think support will hold, and there is a trendline, and long term/short term trend is up, and the COT report suggests it will go up, and you see something in depth of market, and you're reading the volume and there is some candlestick price action to suggest it is going up etc etc, then this is a trade based on confluence. What are you doing that is outside of this? Or are you just using confluence of different things, some of them not in the chart? Nothing wrong with that, but I just don't see a difference. If it is more successful then good for you. Maybe I'll do something similar one day.
And please show me where I've said that. Point it out. Dionysus, you're a smart guy, so I'm surprised at the way that you continue to read what you want to read. Several times in only a few posts I've had to correct you for putting words in my posts that aren't there.If you told me that there was a piece of information out there (technical or fundamental) that would see my current method yield 5% more winners, there is no way on earth I'd say "I make good profits with what I use, no thanks".
So do I. All the time. Always have. Never said I didn't. And as for ways to improve and look for other things, note I wrote "and of course I am very interested in your methods" and am always looking to learn. Again, you don't want to read that, you want to read that I don't care about improving 🙂Mostly though, from what I have seen in the traders I know, they review their winners & losers and use that as the basis to evolve. I have yet to meet someone that says, I will do anything to improve my trading, as long as it only involves looking at a chart.
Now, in future, if you want to make up what people are writing so you can argue with it, please create another account and argue with yourself. Because it is tiring to have to explain myself, simply because you're either lacking in comprehension, or you've already made up your mind what you want to argue with, and so you see that in my posts even when it isn't there.
What is it you want from the thread now?
DionysusToast
Legendary member
- Messages
- 5,965
- Likes
- 1,501
re: Support & Resistance Explained
This is a fairly simple question. Try a backtest of any single piece of TA used in isolation. This could be buying MACD on oversold, MA crossover, reversal at a point of support & resistance. Use that in isolation and without any other analysis. Put in a stop and target that are equal distance from the entry point
When you do this testing, you will find that you have developed a system that will win 50% of the time and lose 50% of the time.
Try it - it will be an eye opener.
I agree with the concept of confluence but only when it is holistic. When you look at a chart, you are looking at a single set of data. There are things that will have an impact on price that are outside that single set of data. The order book for instance is not in the chart. The flow of trades on Time & Sales is not in the chart. Goldman Sachs being investigated for fraud is not on the chart.
If you yourself have already gotten out of the 'only the charts' trap, then I commend you. If however, you think you are looking at different things by applying different things to the chart, then your horizons need to widen.
If you want to see another dimension in action and you are actually available to be at a screen during market hours, get a trial subscription to "flyonthewall.com". Ignore the screen based stuff, just go to the audio section. By doing this, you have given yourself nothing additional to look at but you have something to listen to. You will have added another dimension to your trading. I know people with Bloomberg that subscribe to Fly On The Wall - these guys are that fast at delivering news.
After 2 weeks of this (which is how long I think the trial lasts), you will agree that looking ONLY at charts for 'confluence' is ensuring you miss many opportunities as well as seeing you make trades that you would have stayed out of.
Spy74 put up a good link. Have a look at this section - http://www.proptraders.net/free-prop-trader-training/ look at the diversity in the things they tell you to pay attention to.
Sorry if I have misread you - this is not my intent. We all come from different perspectives and so naturally, anything we read gets read from a specific perspective.
What I was hoping from this thread was for people to actually put forward what makes S&R work/fail in the specific environment (market, timeframe) in which they work. I am rather surprised the argument came to "all environments are the same" and a bunch of generalities and some surpising information on chocolate bars.
You're doing it again. Not reading properly. Take your time and read what is written, and understand it. Don't think that it is saying something more than is written, I write what I mean, not more. You're wrong about the 50%, that's a ridiculous statement if you think about it. Why on earth would every single price point have a 50% chance of going up as well as down? But put that aside.
This is a fairly simple question. Try a backtest of any single piece of TA used in isolation. This could be buying MACD on oversold, MA crossover, reversal at a point of support & resistance. Use that in isolation and without any other analysis. Put in a stop and target that are equal distance from the entry point
When you do this testing, you will find that you have developed a system that will win 50% of the time and lose 50% of the time.
Try it - it will be an eye opener.
Did I say it is "the same"? Did I say 50% is the same as 95%? Or was my point that no matter what the % is, there are no guarantees. So everything "sometimes works and sometimes doesn't". So given that everything sometimes works and sometimes doesn't, then we do our best to maximise the chance of it working. I believe I said this when I wrote "you look for ways to make you correct more often", but you chose to ignore that and place your own words in my post and imply that I don't care whether I win 50% of the time or 95% of the time, lol. One of the methods to improve chances is confluence in my opinion. That does not have to be chart only confluence. If you think the fundamentals suggest and upward move, and you think support will hold, and there is a trendline, and long term/short term trend is up, and the COT report suggests it will go up, and you see something in depth of market, and you're reading the volume and there is some candlestick price action to suggest it is going up etc etc, then this is a trade based on confluence. What are you doing that is outside of this? Or are you just using confluence of different things, some of them not in the chart? Nothing wrong with that, but I just don't see a difference. If it is more successful then good for you. Maybe I'll do something similar one day.
I agree with the concept of confluence but only when it is holistic. When you look at a chart, you are looking at a single set of data. There are things that will have an impact on price that are outside that single set of data. The order book for instance is not in the chart. The flow of trades on Time & Sales is not in the chart. Goldman Sachs being investigated for fraud is not on the chart.
If you yourself have already gotten out of the 'only the charts' trap, then I commend you. If however, you think you are looking at different things by applying different things to the chart, then your horizons need to widen.
If you want to see another dimension in action and you are actually available to be at a screen during market hours, get a trial subscription to "flyonthewall.com". Ignore the screen based stuff, just go to the audio section. By doing this, you have given yourself nothing additional to look at but you have something to listen to. You will have added another dimension to your trading. I know people with Bloomberg that subscribe to Fly On The Wall - these guys are that fast at delivering news.
After 2 weeks of this (which is how long I think the trial lasts), you will agree that looking ONLY at charts for 'confluence' is ensuring you miss many opportunities as well as seeing you make trades that you would have stayed out of.
Spy74 put up a good link. Have a look at this section - http://www.proptraders.net/free-prop-trader-training/ look at the diversity in the things they tell you to pay attention to.
And please show me where I've said that. Point it out. Dionysus, you're a smart guy, so I'm surprised at the way that you continue to read what you want to read. Several times in only a few posts I've had to correct you for putting words in my posts that aren't there.
So do I. All the time. Always have. Never said I didn't. And as for ways to improve and look for other things, note I wrote "and of course I am very interested in your methods" and am always looking to learn. Again, you don't want to read that, you want to read that I don't care about improving 🙂
Now, in future, if you want to make up what people are writing so you can argue with it, please create another account and argue with yourself. Because it is tiring to have to explain myself, simply because you're either lacking in comprehension, or you've already made up your mind what you want to argue with, and so you see that in my posts even when it isn't there.
What is it you want from the thread now?
Sorry if I have misread you - this is not my intent. We all come from different perspectives and so naturally, anything we read gets read from a specific perspective.
What I was hoping from this thread was for people to actually put forward what makes S&R work/fail in the specific environment (market, timeframe) in which they work. I am rather surprised the argument came to "all environments are the same" and a bunch of generalities and some surpising information on chocolate bars.
re: Support & Resistance Explained
I think that it is a subject that has been well discussed over the years and what you want is something new.
Traders put their stops there. Some traders are getting out and others are entering. If the new entrants are more than those closing trades the market will spike. If there are more closes than entries the market will continue into a change of trend.
I have problems with them which aren't worth explanation---I'm not likely to change my mind at this stage of the game!
But there is nothing else, new, about them. In fact, the whole subject of TA has been talked to death, really, which is why new instructional threads thrive for a while and then peter out.
This is a fairly simple question. Try a backtest of any single piece of TA used in isolation. This could be buying MACD on oversold, MA crossover, reversal at a point of support & resistance. Use that in isolation and without any other analysis. Put in a stop and target that are equal distance from the entry point
When you do this testing, you will find that you have developed a system that will win 50% of the time and lose 50% of the time.
Try it - it will be an eye opener.
I agree with the concept of confluence but only when it is holistic. When you look at a chart, you are looking at a single set of data. There are things that will have an impact on price that are outside that single set of data. The order book for instance is not in the chart. The flow of trades on Time & Sales is not in the chart. Goldman Sachs being investigated for fraud is not on the chart.
If you yourself have already gotten out of the 'only the charts' trap, then I commend you. If however, you think you are looking at different things by applying different things to the chart, then your horizons need to widen.
If you want to see another dimension in action and you are actually available to be at a screen during market hours, get a trial subscription to "flyonthewall.com". Ignore the screen based stuff, just go to the audio section. By doing this, you have given yourself nothing additional to look at but you have something to listen to. You will have added another dimension to your trading. I know people with Bloomberg that subscribe to Fly On The Wall - these guys are that fast at delivering news.
After 2 weeks of this (which is how long I think the trial lasts), you will agree that looking ONLY at charts for 'confluence' is ensuring you miss many opportunities as well as seeing you make trades that you would have stayed out of.
Spy74 put up a good link. Have a look at this section - http://www.proptraders.net/free-prop-trader-training/ look at the diversity in the things they tell you to pay attention to.
Sorry if I have misread you - this is not my intent. We all come from different perspectives and so naturally, anything we read gets read from a specific perspective.
What I was hoping from this thread was for people to actually put forward what makes S&R work/fail in the specific environment (market, timeframe) in which they work. I am rather surprised the argument came to "all environments are the same" and a bunch of generalities and some surpising information on chocolate bars.
I think that it is a subject that has been well discussed over the years and what you want is something new.
Traders put their stops there. Some traders are getting out and others are entering. If the new entrants are more than those closing trades the market will spike. If there are more closes than entries the market will continue into a change of trend.
I have problems with them which aren't worth explanation---I'm not likely to change my mind at this stage of the game!
But there is nothing else, new, about them. In fact, the whole subject of TA has been talked to death, really, which is why new instructional threads thrive for a while and then peter out.
Similar threads
- Replies
- 70
- Views
- 18K
- Replies
- 1
- Views
- 8K
- Replies
- 17
- Views
- 7K
- Replies
- 4
- Views
- 3K