dbphoenix said:
These have been the commonly-used definitions of trend for many years, so, yes, they are credible. As to theory, you can define trend any way you want. It's your trading environment. However, defining a downtrend by the presence of both a LH and a LL helps to prevent you from shorting, in an upmove, what turns out to be a retracement or buying what turns out to be a reversal. As for waiting for the LL after a LH, if you don't get one, you don't have a downtrend. You either have a sideways movement of some sort, or a possible preparation for a continuation. If you focus on the LLs and ignore the LHs, you're going to be trying to catch bottoms rather than trade the market flow.
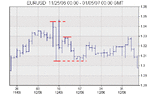
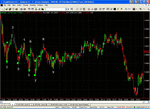
For example, using the chart you posted earlier, all the green dots are potential longs. Which make the most sense?
Hi DBP
I may be wrong, but as I see it, the green dots form 5 pairs of dots - one upper and one lower dot in each pair for the first 4 pairs of dots. The fifth pair of green dots are the two dots to the far right.
Upon first sight, for going long, the chart didn't/doesn't look very appealing to me, due to each option being at or near a new LL.
However, upon close inspection -
Entering long at the close of the candle that the first lower green dot represents makes more sense than entering long at the close of the candle represented by the first upper green dot.
The preferred candle has closed by retracing back into a range, after breaking support/making a LL - showing signs of a retracement up/recovery/strength.
The upper first dots candle is one candle later, and has shown signs of weakness by closing below the previous candles close.
Therefore entering here not only gets you into the long trade later than the previous candle (missing out on some profits), but you're also buying into potential weakness.
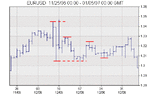
For the second pair of green dots, entering at the close of the candle represented by the lower green dot again seems to make more sense.
The preferred candle again broke the previous support level and closed lower than its open. But after making that LL, price retraces sharply, evident through the long lower spike on the candle, closing within the range of the previous LL - showing signs of a retracement up/recovery/strength.
The candle represented by the 2nd upper green dot not only gets you into the long trade one candle later (when some of the potential profit has been missed), but this candle again shows signs of weakness by closing lower than its open, and lower than the close of the previous candle.
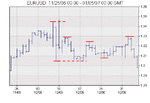
For the third pair of green dots, again going long at the close of the candle represented by the lower green dot seems to make more sense.
The preferred candle has made a new low, but it has closed within the range of the previous candle - showing signs of a retracement up/recovery/strength.
Whereas the candle that the 3rd upper green dot represents, one candle prior to this had made a new LL, showing significant weakness.
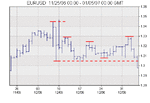
For the 4th pair of dots, buying at the close of the candle represented by the upper green dot makes more sense this time.
The candle prior to this one (represented by the 4th lower green dot) has again made a new LL. Although it has shown some signs of strength by closing 3 pips higher than it's low, it only closes at the same price as the previous LL.
The next (preferred) candle however, shows clearer signs of strength, continuing the retracement from the previous candles low, and closing within the range of the former LL.
With the fifth pair of green dots (two green dots furthest right), going long at the close of the candle represented by the furthermost right green dot seems to make the most sense.
This and the alternative candle (as i see it - represented by the green dot that is 2nd most right) both have seen price recover above 1.3000, following a very recent price fall below 1.3000.
However, the recovery of price above 1.3000 in the candle on the far right seems to take place easier, quicker and more convincingly (within one 10-tick candle as opposed to three 10-tick candles), thus showing greater strength and potential for a continued reversal up.
Buying into (signs of) strength seems to be the recurring theme, and buying into (signs of) strength does make more sense than buying into weakness, especially when looking for price to reverse.
Thanks again.