- Messages
- 549
- Likes
- 2
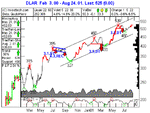
Some of you are probably familiar with the ta site www.investtech.com that has a nice graphical analysis screen that includes total volume plotted vertically on the right hand side for each price.
Does anyone know of a package (eg. AIQ or other) that provides that same facility?
It seems to be really useful for verifying support and resistance levels.
Does anyone know of a package (eg. AIQ or other) that provides that same facility?
It seems to be really useful for verifying support and resistance levels.

