EddieMarkel
Member
- Messages
- 90
- Likes
- 2
this is not consultation or advice.
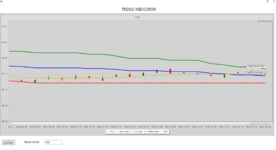
CXTR
touch price 1.1 and stop there.
I Think that CXTR will go up.
the orange line is Dynamic support line.
the target is the green line 1.23.
if the price break the support line , I think CXTR go to 1.03.

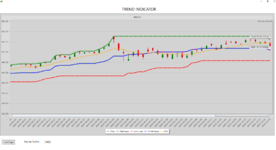
IMAX reached to low target line, that line is a support dynamic line.
it sop on this line several times.
I think IMAX will go up to price 13.

CSV.
CSV price touch level 58.56.
I think that the price go up to 60.8.

NVDA:
the price below EMA (orange).
I think the price go to 520-21 to meet the halfway indicator,
then back up to 571 to meet the high target indicator.
CXTR
touch price 1.1 and stop there.
I Think that CXTR will go up.
the orange line is Dynamic support line.
the target is the green line 1.23.
if the price break the support line , I think CXTR go to 1.03.
IMAX reached to low target line, that line is a support dynamic line.
it sop on this line several times.
I think IMAX will go up to price 13.
CSV.
CSV price touch level 58.56.
I think that the price go up to 60.8.
NVDA:
the price below EMA (orange).
I think the price go to 520-21 to meet the halfway indicator,
then back up to 571 to meet the high target indicator.
Attachments
Last edited: