EddieMarkel
Member
- Messages
- 90
- Likes
- 2
this is not consultation or advice.
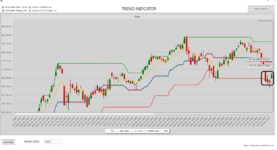
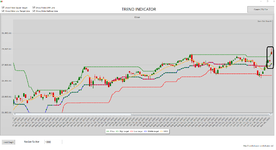
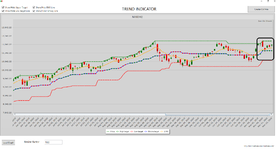
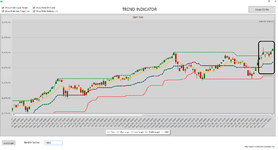
Dow:
Dow show stop signal, it can not break the red line(low target indicator).
The red candle (in the black border), show that Dow don't want go down.
as long as the price stay under the EMA(orange) and the dots(in the red border) are red,
the trend is bearish.
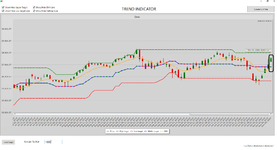
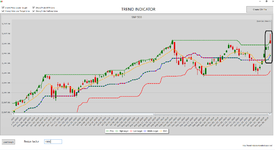
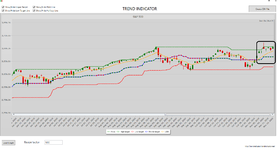
Nasdaq:
I think that nasdaq going to meet the red line(low target indicator) at level 10,551-10,991.
as long as the price is under the EMA line(orange) and the dots on the halfway indicator(blue)
are red, the rend is bearish.
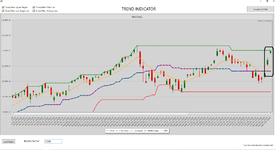
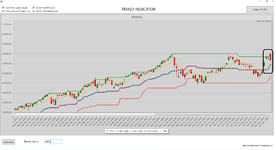
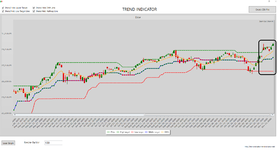
S&P500:
I think that S&P500 will meet the low target indicator(red line) soon.
as long as the price is under the EMA line(orange) and the dots on the halfway indicator(blue)
are red, the rend is bearish.


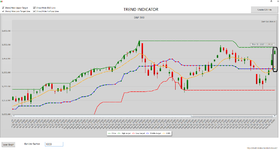
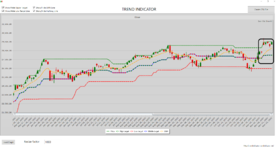
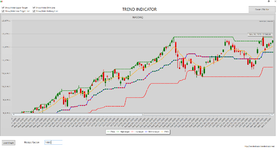
Dow:
Dow show stop signal, it can not break the red line(low target indicator).
The red candle (in the black border), show that Dow don't want go down.
as long as the price stay under the EMA(orange) and the dots(in the red border) are red,
the trend is bearish.
Nasdaq:
I think that nasdaq going to meet the red line(low target indicator) at level 10,551-10,991.
as long as the price is under the EMA line(orange) and the dots on the halfway indicator(blue)
are red, the rend is bearish.
S&P500:
I think that S&P500 will meet the low target indicator(red line) soon.
as long as the price is under the EMA line(orange) and the dots on the halfway indicator(blue)
are red, the rend is bearish.