-
-
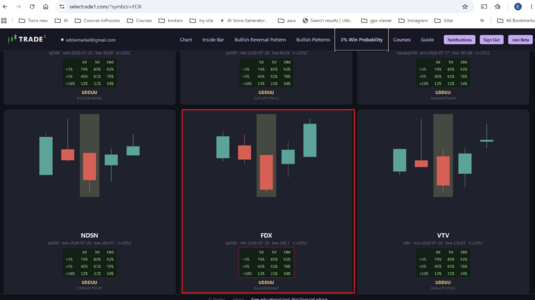
EFDX Stock — Buy Signal High probability of a 3%–5% price increase over the next few days. Technical conditions: Price is above the...
-
-
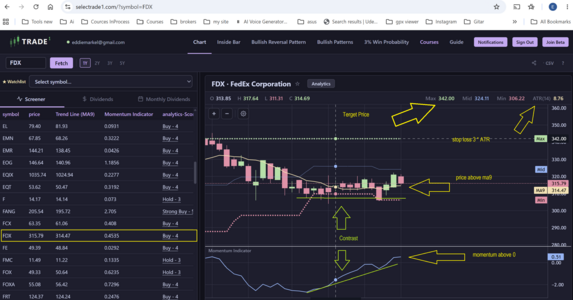
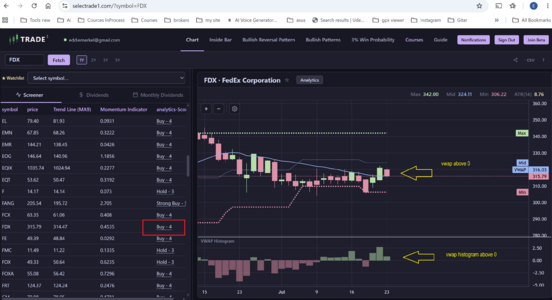
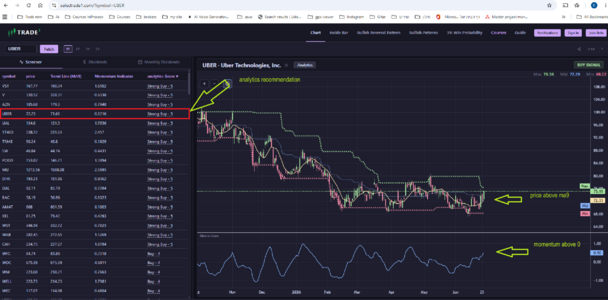
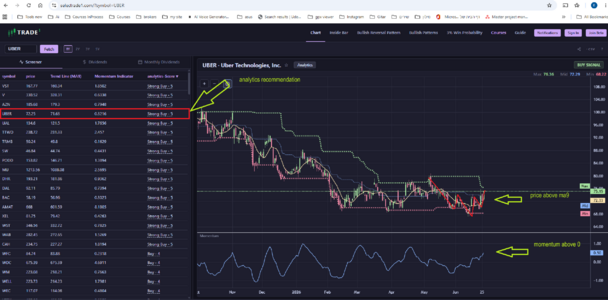
Ethe stock has buy signal. price above ma9 ,and momentum above zero. Analytics score is high.
-
-
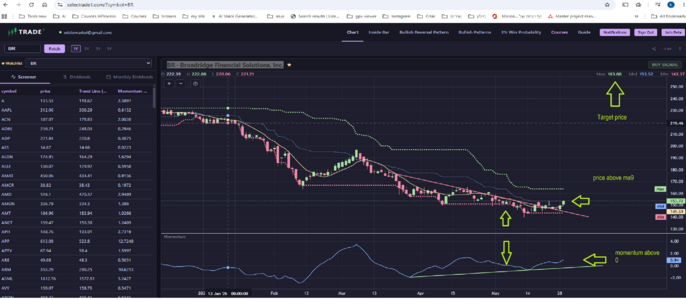
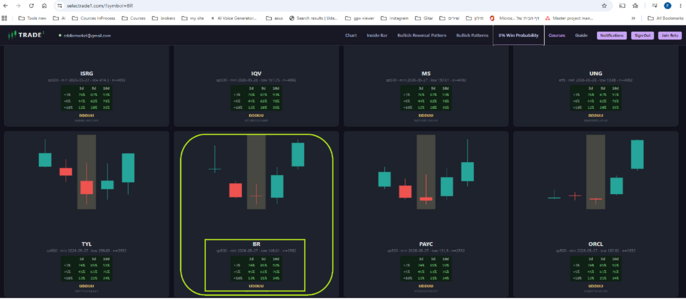
EEddieMarkel replied to the thread bar.It refers to BR. The timeframe is the current timeframe. The sample was taken from over 1,000 stocks. It is probability-based...
-
Eshowing signs of a slowdown in the downtrend. There is a divergence between momentum and the stock price, which indicates a possible...
-
-
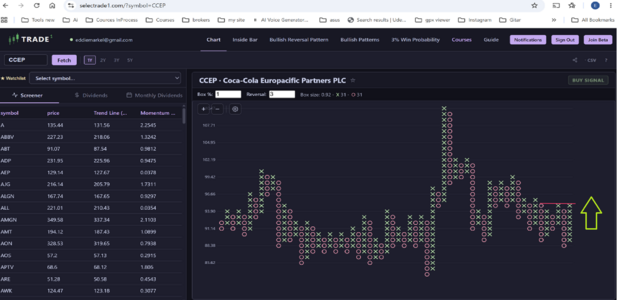
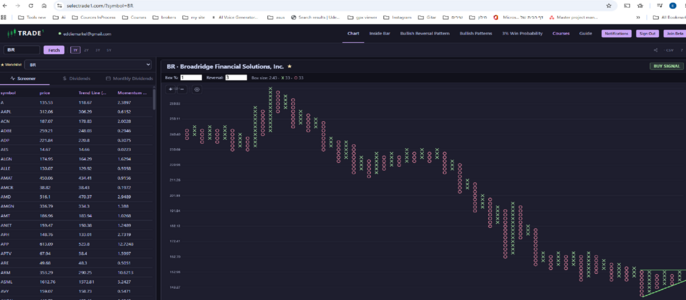
E1. There is a divergence between the momentum oscillator and the price. 2. point and figure show ascending pattern. 3. Statistics show...
-
-
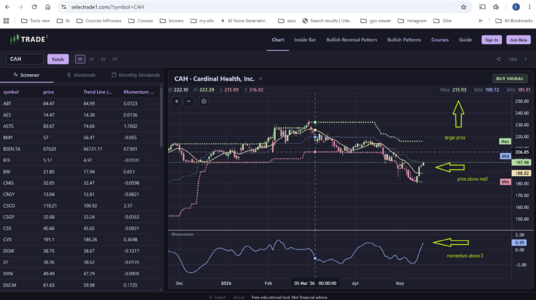
ECAH the price above ma9 and momentum above zero. I Think target price is 215.93
-
-
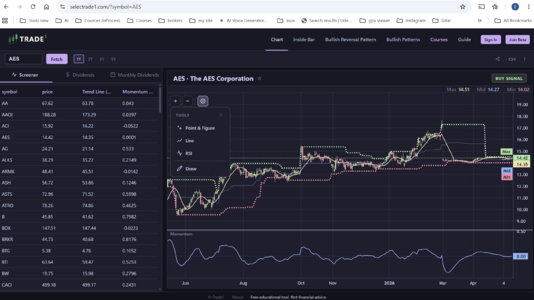
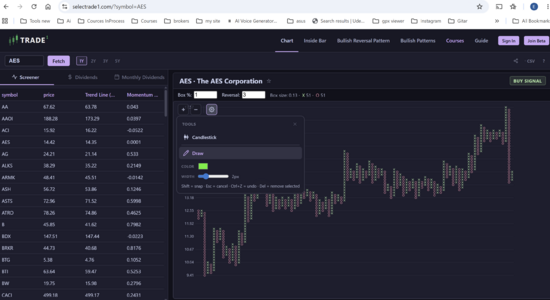
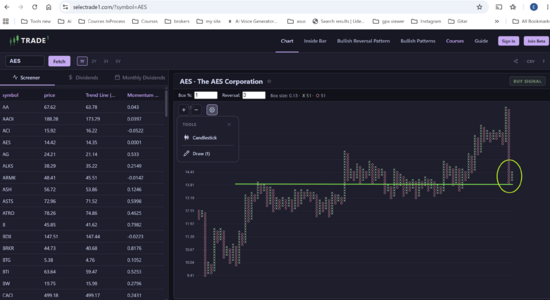
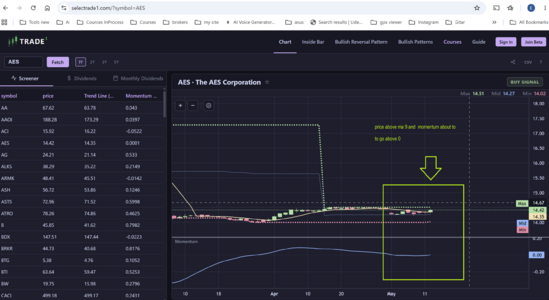
EAES stock is worth paying attention to. According to the P&F chart, the stock has reversed direction to the upside. Based on the...
-
-
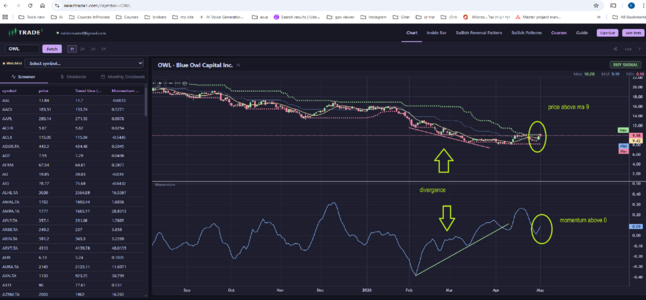
EOWL stock is showing signs of recovery after reaching its yearly low. The stock price has moved above the 9-period moving average, and...
-
-
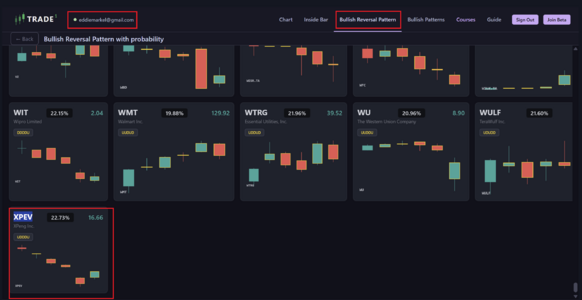
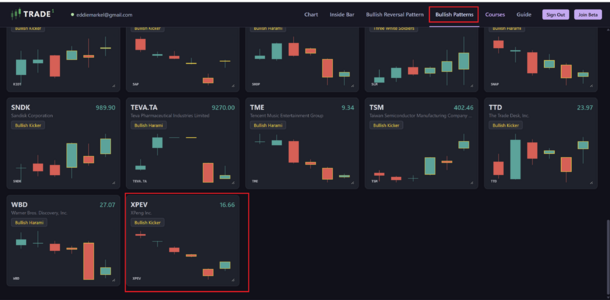
Eafter find the stock in bullish pattern window and in bullish reversal patterns (after registration, its free), I checked it in the...
-
-
-
Loading…
-
Loading…