EddieMarkel
Member
- Messages
- 89
- Likes
- 2
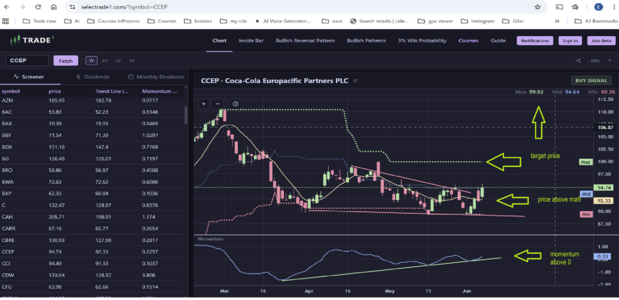
showing signs of a slowdown in the downtrend.
There is a divergence between momentum and the stock price, which indicates a possible trend reversal.
The momentum oscillator has moved into positive territory, above 0.
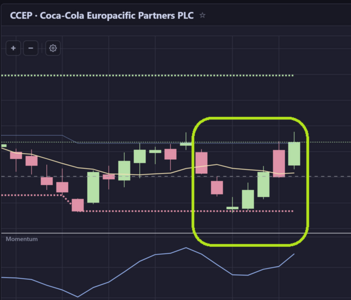
The price has crossed above the MA9.
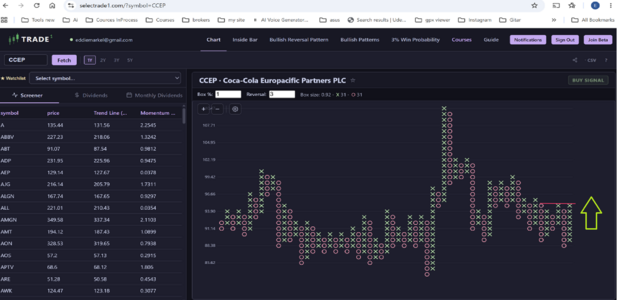
The P&F chart shows a resistance level.
If it breaks above this level, we may see a move toward a price of 99 per share.
There is a divergence between momentum and the stock price, which indicates a possible trend reversal.
The momentum oscillator has moved into positive territory, above 0.
The price has crossed above the MA9.
The P&F chart shows a resistance level.
If it breaks above this level, we may see a move toward a price of 99 per share.