SteamRoller
Member
- Messages
- 70
- Likes
- 15
I’ve decided to start a journal of EURUSD swing trades.
My reason for starting the journal is to improve discipline and consistency in my trading, as well as focussing thought and sharing ideas with others. I have a clear understanding of what I am trying to do, and how. I am not looking to make enormous profits over night, I am looking to achieve consistency in playing out an edge which I am fairly sure exists in my methodology (note ‘fairly sure‘, not ‘absolutely certain‘).
I have back tested the strategy over the last 3 years, and am at the point where I am forward testing it - i.e. trading it with small stakes.
The strategy is discretionary at the higher timeframes (price location / levels) but semi mechanical on the operating timeframe, and with a completely mechanical entry method.
The methodology is this:
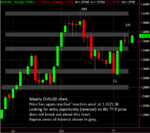
Identify price moving to an ‘area of interest’ on the weekly chart. By ‘area of interest’ I mean a level where a reaction has occurred. For example, previous significant relative swing high / low, congestion or range etc. My expectation is that there is an increased statistical chance of a reaction at such levels. This is my ‘overhead’ or higher timeframe. This is the discretionary / subjective bit.
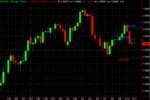
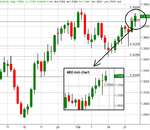
When price is at an area of interest, I will then look at the 8 hour (480 minute chart). This obviously gives 3 bars per day. I am UK based and using 22.00 - 06.00 (Asian session bar), 06.00 - 14.00 (European session bar) and 14.00 to 22.00 (US session bar). I can see two of the bars close and the next open, at 6am and 10pm. I am at work when the 14.00 close occurs.
For example, if the 8 hour chart shows an uptrend (characterised by HHs and HLs) then I will look to enter on a reversal of trend as defined by a bias change on this timeframe. I interpret that to be a break below the most recent (highest) Relative Swing Low. Opposite for downtrends. This would be the first sign of a new downtrend (using this analysis). I am prepared to trade the bias change itself rather than await confirmation (breakthrough, pullback, continuation), due to the entry method (next point below).
The method of entry is using automated entries with 20 pip stop losses, but if the entry is stopped out, a new order to enter is replaced, which remains all the time the 8 hour TA confirms this is applicable. I am using ‘staged’ orders on TradeStation with a series of linked OSOs to simulate automation, but have the orders sent to the broker, rather than rely on running a TradeStation strategy.
The two advantages of this method are (1) you cannot get left behind in a big move by being ‘just stopped out’ and then the market going without you, and (2) if you are just stopped in to a trade which then goes immediately against you, you lose only 20 pips, not the 100 pips + that would be generated by a natural stop size based on TA / ATR for an 8 hour chart on EURUSD. The disadvantage is that if a entry level is reached and price meanders along sideways you can get stopped in and out and so can suffer a number of ‘whips’ before the trade either goes my way, or invalidates, for the reason of subsequent price action. It’s never much more than about 8 hours before I can re-evaluate though.
I am fairly sure (but not certain, hence the journal) that there is an edge in this and that there will be a positive expectancy, based on non-random behaviour / reaction at key levels, getting into trends early, and keeping losses very small, and running trends.
Trades will be run until a bias change against the trade direction, which would / could indicate a trade opportunity in the other direction, subject to being at a suitable (discretionary) level to enter. Initially I am using 2 mini contracts, taking profits on the first around 150-200 pips, and running the second with a trailing stop below /above swing points but with a target of 500 pips, since few swings on the 8 hour TF go much further than 500 pips.
So that’s it really, no fancy indicators, no unrealistic expectations, just based on price triggers at key reaction zones…
I’ll post up charts as trades unfold. Today bias changed to down. I didn’t go short at 1.3760 as I was at work (annoyingly the only bar I don’t see close is at 2pm, it remains to be seen how much of a weakness this is overall), but as we are now biased short I will look for a pullback and short entry possibility. Looking to the weekly chart, potentially there is a weekly pin bar in the making depending on what happens tomorrow.
Obviously though, I will trade what I see on the charts, not opinion…I have no ‘opinion’. I am reacting to what is happening and trying to get on board.
Thanks!
Dave.
Last edited:


