Take a look at the nice up-trend on the chart below. There are plenty of reasons to have entered around £10 and sat comfortably in your armchair until some warning signs and an exit around £14, or even higher. A 40% rise and an easy 400 or so points - easy in hindsight that is. We can't trade hindsight, of course, but a simple swing trading technique would have served you well in real time.
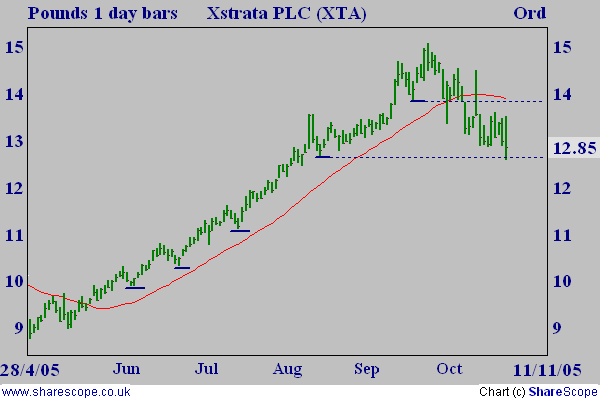
Good trends like this develop by taking a run forward followed by a few paces back (retracement) followed by another run forward and a few paces back and so on. Simple swing trading seeks to take advantage of trend continuations by identifying those significant retracements in order to provide points of entry and a level of exit for ongoing trades. The low point of each retracement constitutes a swing low - the blue horizontal lines - and you can see that entry after each of these (except the last, maybe) would have brought good rewards.
So, is it as simple as it looks? Of course not. For a start, there are important questions of definition in relation to trend and retracement, as well as entry and exit criteria, that need to be answered and established. I will go on to discuss these, but it is important to realise that each trader must arrive at their own conclusions for themselves in a way that is consistent with their trading instrument(s), time frame, style, attitude to risk etc.
Defining trend
There is no problem in seeing the up-trend in the first chart. It is really easy in hindsight, but what if all you have is this:
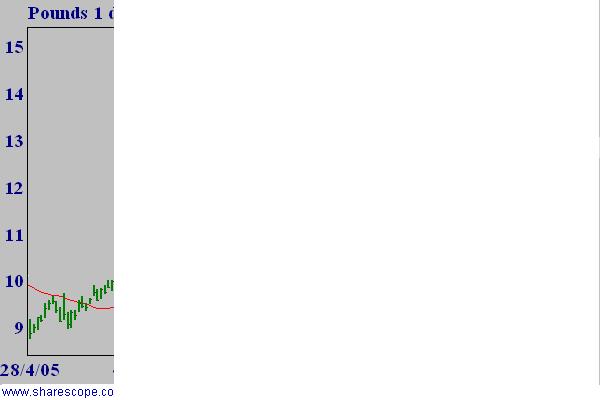
An up-trend starting or what? No answers here. Each will have their own determination of what constitutes a trend change, whether it be judged on the price action alone or moving averages or a favoured indicator or some combination of those. If XTA had been in a down-trend some swing traders would be looking for a break through the last swing high of that down-trend to signal a potential trend change.
At this stage what happens at the first significant reaction will be informative and if it turns out to be the first retracement of a new up-trend with the price then moving to new highs, then simple swing trading assumes an up-trend to remain in force until such time as the most recent swing low is breached - which happened in this case at around the £14 level as you can see in the first chart. You will spot that there are difficulties in this simple approach when the swing low is nearby - is it a potential trend change or a false swing low? - or when it is far away, so some element of judgement, or alternative methodology, must be introduced. .
But what constitutes a significant retracement leading to a swing low?
Defining retracement
Simple swing trading relies on the method used by W.D. Gann.who identified potential swing lows by requiring a minimum of three consecutive bars of lower highs and lower lows, with the final bar in the series making the potential swing low bar. The potential swing low bar gains initial confirmation when the price moves and remains above the high of that swing low bar and final confirmation when the price rises to a new high for the trend.
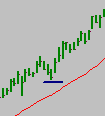
I have zoomed in on the third retracement from the first chart since it is a classic Gann 3-bar retracement . Others, such as Marc Rivalland, modify Gann's requirement by stipulating that these bars do not need to occur consecutively. In either case the retracement can run to more than three bars of lower high and lower lows, although many traders will place some limit. A popular rule is that the number of bars in the retracement should not exceed the number of bars in the previous up leg, although many will have abandoned any thought of a trade well before then.
Still others combine the use of Fibonnacci retracement levels with these methods to identify where substantive swing lows are likely to occur.
Once again, it is up to each trader to determine the precise definition to be used.
When to enter?
Aggressive traders will enter as soon as the price exceeds the potential swing low bar high. The more cautious may wait to see a close above that high and enter at the best price available in the next session. And the even more cautious may await the final confirmation of the swing low as the price makes a new high for the trend.
It is logical to place a stoploss just below that same bar's low in case it turns out not to be a true swing low bar. The effect of this is that more aggressive traders have the least money at risk, although they are likely to suffer a greater incidence of false signals and consequent triggering of their stop loss.
When to exit?
It is often the case with a mechanical method that exits prove more problematic than entries. Simple swing trading is no exception. The basic principle is to stay with the trade and exit on a breach of the most recent swing low. Such an approach would have worked well in this XTA example where most of the trend would have been captured and if all trends were so well-behaved there would be little problem. It won't surprise you that most are not.
The main problem is the same as I mentioned in the section about trend definition and comes when the price has moved far away from the most recent swing low. It is clearly absurd to watch healthy gains waste away - possibly into loss if the most recent swing low had triggered your opening trade - waiting for this breach. Alternative exit methods must be developed to guard against this danger when such circumstances arise.
Conclusion
I have sought to discuss the basics of a simple swing trading method and this article is not intended as anything other than a sketchy outline. I have touched on a number of questions and others will have occurred to you if you are interested in such a method. It is for each to answer those questions for themselves as they develop (and test) their set-up and trading plan. I hope, at least, that I have given you food for thought.
Good trends like this develop by taking a run forward followed by a few paces back (retracement) followed by another run forward and a few paces back and so on. Simple swing trading seeks to take advantage of trend continuations by identifying those significant retracements in order to provide points of entry and a level of exit for ongoing trades. The low point of each retracement constitutes a swing low - the blue horizontal lines - and you can see that entry after each of these (except the last, maybe) would have brought good rewards.
So, is it as simple as it looks? Of course not. For a start, there are important questions of definition in relation to trend and retracement, as well as entry and exit criteria, that need to be answered and established. I will go on to discuss these, but it is important to realise that each trader must arrive at their own conclusions for themselves in a way that is consistent with their trading instrument(s), time frame, style, attitude to risk etc.
Defining trend
There is no problem in seeing the up-trend in the first chart. It is really easy in hindsight, but what if all you have is this:
An up-trend starting or what? No answers here. Each will have their own determination of what constitutes a trend change, whether it be judged on the price action alone or moving averages or a favoured indicator or some combination of those. If XTA had been in a down-trend some swing traders would be looking for a break through the last swing high of that down-trend to signal a potential trend change.
At this stage what happens at the first significant reaction will be informative and if it turns out to be the first retracement of a new up-trend with the price then moving to new highs, then simple swing trading assumes an up-trend to remain in force until such time as the most recent swing low is breached - which happened in this case at around the £14 level as you can see in the first chart. You will spot that there are difficulties in this simple approach when the swing low is nearby - is it a potential trend change or a false swing low? - or when it is far away, so some element of judgement, or alternative methodology, must be introduced. .
But what constitutes a significant retracement leading to a swing low?
Defining retracement
Simple swing trading relies on the method used by W.D. Gann.who identified potential swing lows by requiring a minimum of three consecutive bars of lower highs and lower lows, with the final bar in the series making the potential swing low bar. The potential swing low bar gains initial confirmation when the price moves and remains above the high of that swing low bar and final confirmation when the price rises to a new high for the trend.
I have zoomed in on the third retracement from the first chart since it is a classic Gann 3-bar retracement . Others, such as Marc Rivalland, modify Gann's requirement by stipulating that these bars do not need to occur consecutively. In either case the retracement can run to more than three bars of lower high and lower lows, although many traders will place some limit. A popular rule is that the number of bars in the retracement should not exceed the number of bars in the previous up leg, although many will have abandoned any thought of a trade well before then.
Still others combine the use of Fibonnacci retracement levels with these methods to identify where substantive swing lows are likely to occur.
Once again, it is up to each trader to determine the precise definition to be used.
When to enter?
Aggressive traders will enter as soon as the price exceeds the potential swing low bar high. The more cautious may wait to see a close above that high and enter at the best price available in the next session. And the even more cautious may await the final confirmation of the swing low as the price makes a new high for the trend.
It is logical to place a stoploss just below that same bar's low in case it turns out not to be a true swing low bar. The effect of this is that more aggressive traders have the least money at risk, although they are likely to suffer a greater incidence of false signals and consequent triggering of their stop loss.
When to exit?
It is often the case with a mechanical method that exits prove more problematic than entries. Simple swing trading is no exception. The basic principle is to stay with the trade and exit on a breach of the most recent swing low. Such an approach would have worked well in this XTA example where most of the trend would have been captured and if all trends were so well-behaved there would be little problem. It won't surprise you that most are not.
The main problem is the same as I mentioned in the section about trend definition and comes when the price has moved far away from the most recent swing low. It is clearly absurd to watch healthy gains waste away - possibly into loss if the most recent swing low had triggered your opening trade - waiting for this breach. Alternative exit methods must be developed to guard against this danger when such circumstances arise.
Conclusion
I have sought to discuss the basics of a simple swing trading method and this article is not intended as anything other than a sketchy outline. I have touched on a number of questions and others will have occurred to you if you are interested in such a method. It is for each to answer those questions for themselves as they develop (and test) their set-up and trading plan. I hope, at least, that I have given you food for thought.
Last edited by a moderator: