Starting a trading journal based on my understanding of Wyckoff's work

Nickel looking like it's going through a reaction. Weekly shows a nice solid advance with good volume but the daily shows dull price action at the top with decreasing activity. This could be due to the influence of the mid December to mid January support area.
A normal reaction here would be back to the pink resistance area or thereabouts.
Weekly
qe00eNiF

Daily
frvvg2eZ


30 minute shows a clear shift in momentum, especially when taking into account the increased volume on the last bar.
xSccEk5V
 
DJI could also be preparing for a correction. Weekly shows a longer down wave and no demand (dull price action and decreased volume) at the rally top.
Weekly.
P0EDbU2S

Daily shows an entrance into a trading range. Strong volume at the top of the range followed by a drying up on the retest shows the upper boundary as solid resistance.
6wIvczgu
 
Nasdaq weekly's minor trend is now ranging, after an extremely steep climb. Technically not overbought but it is in a position for a minor downswing which would make it an intermediate downswing on the daily charts.
eJkvPFov

Hard to judge without volume but it seems that the intermediate trend went into neutral on the 13th of July and into a definite bearish state on the 23rd.
fyzTgTf8

Because of the state of the index we will be taking short positions in AMD.
AMD is actually looking strong on the weekly chart, the spike in volume is normal when going through a previous resistance zone.
8zE38WhP

The daily suggests an overbought position as the rise of 21% in the last 2 days.
kGQTtl5x

The 30 minute shows a shortening of the thrust with diminishing volume after encountering heavy resistance at the opening. The climactic volume is the reason we are expecting a downswing of decent proportions, allowing us a favorable risk to reward ration.
qgWKqpfz

We're taking a short at 68.98, with a stop loss at 72.1.

Result: Our stop loss was taken out way past 72.1 when price gapped and opened higher at 75.43. Will need to incorporate some sort of strategy to cope with this sort of gapping.
 
Last edited:
Doing a revamp of the whole journal, starting from scratch.

Will begin by posting observations first, then I'll follow with a trading plan and back testing and forward testing after that, before going live.


Objectives
Trading part-time, transition later on if the results are good.

Markets & Instruments
Focusing on the NQ, ES, and maybe some commodities like Oil and Nickel for the observation phase. For testing and trading will probably stick to the NQ.

Style
Swing trading. I try to limit my trading to 2 or 3 trades/day.

Timeframes
Weekly for direction on the daily, daily for the actual trade. Intraday will be based on the 5 minute with 1 minute for entries.

Reversals, Breakouts or Retracements?
All of the above once strategies are in place. Will start with reversals and retracements.

Trade Set Up
Identify momentum shift through watching how price reacts at the halfway point (50% retracement).
 
We start out this observation with the March contract for the ES. Time interval is 5 minutes.

We can see that on the bigger time frames we're in some sort of range at the top of an upmove. The 5 minute intermediate trend shows bullish action as the plunge was reversed and we're near the top of the origin of the selling wave.
1611568299989.png

Buying pressure pushes price past the 50% retracement of the bigger down move, indicating that on the larger time frame we are either going to start ranging or we're in the beginning of a larger push up. (point A)
Selling pressure immediately pushes this down past the same price area, signalling that the smaller intermediate bullish swing is over for the time being.
No one in charge so far on the larger time scale, maybe bears taking charge on the smaller intervals.
1611568714672.png

Selling pressure reaches the 50% retracement area of the last bullish upswing, pauses, then pushes through and now seems to be rejecting a rally (point B). Support turned into Resistance. This area also coincides with the support zone of the previous range. Sellers firmly in control of this time interval and perhaps this is the beginning of the shift in the larger time interval as well.
1611569091054.png

Buying pressure pushes price back up through what is now resistance, sellers take it back down and form a lower low. Buyers then retrace 50% of that last downswing (which coincides with the 50% area of the previous up swing), and seem to be holding above that area. Resistance turned to support but maybe more importantly, the halfway point of the downswing is being rejected by buying pressure. Change in demand and supply. I'd expect it to start ranging now, if not make an attempt at a higher high.
1611569474633.png

Price starts forming a hinge, breaks to the upside, retraces to test the midpoint, and bounces off. Possible springboard for a push upwards.
1611569855676.png

Price tests the midpoint once again and takes off, taking out the 50% retracement of the bigger downswing in the process. Buying pressure has overwhelmed selling pressure and it seems like we're ready to continue with the larger move upwards.
1611570056382.png

Price breaks down, breaking the upward stride, and creating a new lower low, before attempting to bounce off the hinge midpoint once again. No one is clearly in charge though it's still nominally bullish because the upwards spike breached the hinge high while this reaction has not breached the hinge low.
1611570327530.png

Price seems to be trapped in a bigger hinge. Selling pressure rejects the midpoint, breaks down, and starts to bounce off the midpoint of the smaller hinge. Sellers now seem to be in control and this could shape up to be the springboard for the move down instead of up.
1611570701553.png

Price breaks down as expected, then stops short and starts to act like there might be another momentum change in the making.
1611571007292.png

Buying pressure starts to use the smaller hinge midpoint, then the 50% ret of the last selling wave, as support as it pushes higher. Buyers in control. Price then reaches the midpoint of the bigger hinge and launches off that as well. Smaller and bigger time intervals are aligned.
1611571266763.png

Price makes two attempts to break the origin of the selling wave then falls back, breaking its stride and forming a lower low. Buyers are still nominally in control but there is a possibility of a reversal at this juncture. Price then rejects the bigger hinge midpoint and forms another low. At this point we conclude we are just ranging with no one in firm control.
1611571527622.png


Failed breakout attempt, we expect price to travel all the way down to range support.
1611571759531.png

Buying pressure makes another attempt but it fails to breach the 50% area of the selling wave, and doesn't even reach the range high. We stay bearish.
1611571964471.png

Another change in momentum, it feels like price will make yet another attempt to break through.
1611572130949.png

Another attempt to break through, fails, and price finally its way back to range support.
1611572293286.png

Downward stride broken at support. We look like we're heading back up again.
1611572422357.png


As expected we head up but not before a deep shakeout to the downside. This shakeout leads us to believe that there will be another serious attempt at breaking through the range top.
1611572543939.png

Anemic try, didn't even get close to the top before the rally's 50% area was broken through. This is important because the reaction to the strong spike downwards is not replied to in kind. Sellers in control.
1611572755778.png

That turned out to be the springboard for the reversal on the larger time intervals. Price then breaks down all the way.
1611572920661.png
 
Price here has broken the downward stride and retraced 100% of the last minor selling wave.
1611925756571.png

Buying pressure pushes it to the 50% area of the downward move where it accelerates to break through it. Sudden reversal, buyers in control.
1611925963772.png

There is a shallow retracement near the top as price meets a previous area of supply, then continues to accelerate in a vertical manner. At this point we seem to be approaching an overbought condition due to the angle and speed of the advance.
1611926094302.png

Buying pressure slacks off and price exits the upward stride, forms a low and tries again, and gets rejected decisively without reaching the previous high. If we expect buyers to maintain control price needs to find support here or at the 50% area slightly lower.
1611926358514.png

Buying pressure enters briefly before being withdrawn, giving control to the sellers.
1611926503445.png

Another attempt by buyers to support price and reverse the bear trend however selling pressure completely overwhelms them.
1611926688858.png

Buying pressure suddenly enters and takes out the 50% area of the last bearish wave, giving control back to the buyers. A look at the broader price action indicates that the longer-term bear movement is probably at its end and that this could be the beginning of a broader and longer-term move to the upside.
1611926867304.png

Intermediate trend now neutral, signalling that what happens from here on out will determine whether the bear movement will continue or if we will start trending to the upside.
1611927015000.png

Selling pressure almost drives price down past the halfway point of the last rally, which would have continued the mostly equally-matched push and pull in the range, but fails to breach and rebounds strongly. Buyers are expressing their intent to take control of the larger trend. Price has broken out of the range, now it needs to hold the ground it has gained to firmly cement the control of the buyers.
1611927482320.png

Price rises vertically with only a short stop at the last swing high area, before continuing on its way upwards. Buyers are definitely in control.
1611927593535.png

Very short retracement to the top of the previous supply area. We seem to have reached an overbought condition due to the fact that there have been no major resting periods or consolidations, and the angle of ascent is very steep.
1611927844396.png

A decisive turn at the top coupled with a weak second attempt at the top leads us to believe that buying pressure has largely left and we will either continue ranging or this could be the start of a reversal. Intermediate trend is now neutral.
1611928168833.png

Price starts to telegraph the intention of participants to take price lower.
1611928273034.png

A study of volume at this area shows that participation was withdrawn when price rallied and resumed when price reacted, confirming the bearish change in character.
1611928439492.png

Sellers take control and push price down to the halfway point of the last bullish movement. Here it rebounds and shows signs of buying pressure increasing. For the overall bullish movement to continue price needs to hold here.
1611928588146.png

Buying pressure overwhelms selling pressure and reverses the direction of price at the halfway point of the last reaction. Meanwhile volume starts to increase during the rallies, signalling a probable continuation of the overall bullish move.
1611928767502.png

Rejection at a lower level than the previous high, followed by a third attempt which is rejected even lower, starts to signal weakness.
1611928985049.png

Price starts to show signs of an impending reversal. The upward stride has been broken and price starts to make lower lows.
1611929210231.png

Sellers in control as successive rallies fail to break the halfway points of the reactions and price continues downwards.
1611929302938.png

Buying pressure halts the downward movement and causes a rally, which stops at the same area as the previous swing highs. Intermediate trend neutral.
1611929490874.png

Buying pressure absorbs selling pressure in a sudden reversal, putting the buyers back in control.
1611929592260.png
 

Attachments

  • 1611929464139.png
    1611929464139.png
    115.5 KB · Views: 161
We start today's observation by noting that the downward trend on the ES seems to be over with the intermediate trend shifting to neutral.
1612074233411.png

Price action starts to narrow, showing some temporary form of equilibrium. This is usually the precursor to the next move, which later on seems to suggest a move to the upside due to the fact that buying pressure increases resulting in price pushing off the halfway point of the last directional selling wave.
1612074611520.png

Price retests the 50% area before making an attempt to head higher. However it seems that there is currently not enough interest to push price higher and the intermediate trend goes back to a neutral state, albeit one that is slightly more bullish than previous. A breach of the support area from where price made its move would signify a return of control to the sellers.
1612074834149.png

Price continues to range but there seems to be a definite imbalance skewing towards demand as evidenced by price continuously retracing 100% of the minor selling waves while not quite getting there with the minor buying waves. Support points are starting to rise, giving us the idea that some sort of absorption is going on.
1612075045939.png

After rebounding off the halfway point of the last selling wave at point A, buying pressure makes price break through the trading range, wherein it retraced and tested the upper area. The stage is set for an upward swing.
1612075340428.png

Price again fails to attract a bull following and forms a lower high, signalling a return to a neutral trend, before falling and creating a lower low and at the same time breaching the halfway point of the upward movement. Control has been ceded back to the sellers.
1612075568072.png

Selling pressure pushes price all the way back down to the support area of the trading range, where price spikes up and breaches the halfway point of the selling wave. At this point an investigation of the volume at support makes us once again think that there has been absorption going on to prepare for a move to the upside. This is due to:
A. Increase of volume at point B and a failure to follow through suggesting that this was a mini-selling climax.
B. Strong impulse upwards with higher volume at point C.
C. The failure of the selling wave following the failed bull breach of the trading range to cause a similar breach of support.
1612076074595.png

Price forms a mini trading range in the upper area of the original trading range. If our assumption of buying pressure is correct, this is the final phase of absorption before a breakout to the upside. This happens later on and we're now in the early stages of an upward swing.
1612076464723.png

Price retraces slightly higher than the halfway point. Buyers in control.
1612076662085.png

Price then proceeds to form a lower high and a lower low, signalling that control has now shifted to the sellers. Price is now at a critical juncture, as it's now at the halfway point of the last rise. If it breaks through here we can expect the larger bearish movement to continue.
1612076831491.png

Price hugs the support area then pushes off it, reaching the halfway point of the selling wave and starts to break out. Here the market is telling us that the line of least resistance is still up and we expect a continuation of the bull movement.
1612076969531.png

Contrary to our expectations price rotates around the halfway point for a bit before heading back down. The intermediate trend is back in neutral and the minor upswing seems to be over. We expect we will start ranging until another imbalance is created for the next move.
1612077148424.png

We don't range for long, buying pressure has again increased and price is making another attempt at going higher.
1612077284770.png

Buying momentum slows down and a reversal seems to be taking place.
1612077573439.png

Buyers have other ideas and price instead continues on its upwards journey.
1612077670748.png
 
So it seems that we can use the midpoint to determine, ahead of any obvious reversal, a change in the demand/supply dynamic. I'll be going back some old charts to spot any "tells" that seem to happen.
Reading the chart left to right we can see that the midpoint of the last breakdown served as a confirmation of continuity even when the trend line was broken, and as a warning of an impending reversal when the same trend line was broken. We can see that as long as the buyers or sellers fail to successfully breach the midpoint of the last movement, that the trend will continue or at best will range.
Reversals are confirmed by a successful breach and retest of the midpoint. This includes midpoints of ranges, not just buying or selling waves.
1612266387730.png

Continuing on to see if this is always the case:
Here we see the beginning phases of the previous post's chart. So far we can note that prior to any confirmed break and successful retest of the midpoint the trend line is almost always broken first. This validates its use as a momentum indicator. We can also note that a trend line break alone is a lousy indicator for a reversal, in that most of the instances a trend line break resulted in a continuation.
1612267616699.png

So far the midpoints to watch when marking potential reversals seem to be the midpoint of the last move, and the midpoint of the secondary reaction.
Continuing on to see if this matches further in the chart.
Here we see that it's important to clearly define what's a successful break or not, to determine if there is a true change in the balance of supply and demand or if it's just temporary consolidation. In the two examples below, price breaks the trend line, stays well above the main midpoint, but flirts around the midpoint of the secondary reaction. With clearly defined criteria for a break of the midpoint, we can ignore what seem to be reversals but are in reality retracements and can also spot reversals early.
1612268645604.png

Going further to see if this theory pans out.
In the first example price breaks the trend line, stays above the primary midpoint, rotates around the midpoint of the secondary reaction, then heads north. This is the same as the previous examples. In the second example however price retraces to the midpoint even before breaking the trend line and starts to hang around there. Once the trend line is broken it then breaks down, signalling the end of the current upward swing and maybe the start of a bearish movement. It dips lower then takes out the new bearish trend line, then proceeds to hover below the selling wave midpoint. From here on out it starts to range.
1612271095926.png

So what seems to happen is that whichever is violated first, the main midpoint or the secondary reaction's midpoint, sends a fairly accurate signal of a change in demand and supply. Many times this is first telegraphed by a break of the trend line, although such a break just tells us to start paying closer attention to the midpoints.
The next thing to determine is is a reversal off either the primary or secondary reaction midpoint enough of a reason to enter a reversal trade or are there other factors needed?
 

Attachments

  • 1612270220575.png
    1612270220575.png
    262.7 KB · Views: 165
We start with the second leg TL and first leg TL broken. Price is rejected off the primary trend's midpoint but seems to have found support at the secondary reaction's midpoint.
1612675692522.png

The imbalance seems to have shifted to the demand side as price rallies strongly away from the secondary mid point and breaks through the first midpoint. What is missing here is a higher low to confirm the bullish swing. Buyers in control.
1612675807090.png

Price forms a higher high then retests the primary midpoint successfully. We now draw a support line to track the bullish swing.
1612675989210.png

A sudden reversal causes the intermediate trend to shift back to the bear's side. This is due to the midpoint of the bull swing having been violated.
1612676221520.png

Failure to rally at A, which was the start of the previous bull swing, causes selling pressure to increase and pushes price into lower ground.
1612676459587.png

Another sudden reversal, this time on the bull side, causes control to shift to the demand side. Price retraces 50% before finding support and attempting to go higher. The test now becomes breaking through the midpoint of the last bear swing.
1612677000980.png

Price is rejected at the midpoint of the main bear swing. The intermediate trend is still up but a failure to hold at the midpoint of this last bull rally would mean that the trend has once again shifted back to the sell side.
1612677164249.png

Price breaks the support line but seems to be holding at the bear swing mipoint. This in itself is bullish because there doesn't seem to be enough selling pressure to force price back down to lower areas.
1612677320731.png

Price decisively rallies off the midpoint at C. The trend now favors the buyers.
1612677395907.png

Price makes its way almost all the way up to the last bullish swing area before breaking the support line. We expect it to start ranging here but so far there is no bearish action.
1612677880335.png

Price retraces to the vicinity of the midpoint and seems to have found support.
1612677955864.png

A quick reversal and the intermediate trend now favors the sell side as price breaks through the last halfway point.
1612678083242.png

After a successful test of the midpoint that seems to have cemented control to the bear side buying pressure suddenly forces price to reverse violently and takes it up even higher than before.
1612678193674.png

Price forms a lower high at D. Given the short-lived rally this might be the beginning of a longer move to the downside. Price needs to hold above the halfway point to maintain its bullish nature.
1612678383662.png

Price makes a quick trip higher before breaking the support line and testing the halfway point. Here it rallies successfully and goes into higher ground. Bulls firmly in control so far.
1612678497005.png
Buying pressure again supports price after it breaks the secondary support line and drifts to the vicinity of the halfway point.
1612678626588.png

Buying pressure falters and price makes a lower high. This is the shortest of the previous 3 buying waves, and price seems to be at a standstill. A reversal at the midpoint of the secondary reaction at AA would signal a shift in the demand/supply balance while a successful breach of the last upswing midpoint at BB would confirm enough of an imbalance to create a serious countermove.
1612680601777.png

At first there seemed to be a successful attempt at reversing off the midpoint at AA but the main halfway point of the bull swing at BB holds and price continues its journey upwards.
1612680803060.png
 
So so far the earliest high probability "tell" of an ongoing reversal is when price first uses the halfway point of the secondary reaction as a jump off point, with the successful breach of the last swing's halfway point as the confirmation of a successful reversal.
Using the break of the last trendline as a momentum indicator to tell us what to look for, we'll see if this is enough to trade profitably.
SETUP: Enter when price breaks its stride and reverses off the secondary reaction's midpoint.
Stop loss: Below the low that reverses off the midpoint.
Exit: When price breaks its stride and either reverses off the halfway point of the last swing or the secondary reaction that occurs after breaking stride, whichever comes first.
Early exit after entry: When price either breaks the halfway point used as the origin for the reversal or forms a lower low (in the case of a reversal to the upside), or a lower high (in the case of a reversal to the downside).
Caveats: If the halfway point of the secondary reaction is quite close to the halfway point of the last swing, we will wait for the halfway point of the last swing to be successfully violated.
We will be trading only reversals and retracements (when the retracement is deep enough to warrant a supply line, which makes it a reversal).

So here we're starting with a reversal off the downside and the beginnings of an uptrend.
1612693743268.png

Here price breaks the support line and successfully reverses off the midpoint, but is quite close the last swing midpoint, so we wait for that to be breached, or in the event of a bounce there, we enter it in the direction of the current trend.
1612694110493.png

Price pokes the halfway point, then breaks down further. We enter short here with the stop loss slightly above the halfway point of the selling wave where the "x" is.
1612694266321.png

Price retraces almost the entire move, then rallies and tries to breach the selling wave's halfway point, which coincides with the previous buying wave's halfway point. It fails and drops again. At this point we move the stop loss to breakeven. If price fails to break down further it could mean that the longer-term bearish swing is done and we should go long.
1612694637066.png

Buying pressure forces price to do just that and we close our short BE and open a long at the same time.
Total trades: 2
Win:0, Loss:0, BE: 1
1612694736134.png

Price then fails to rally higher and promptly hits our stop. Sellers back in control.
Total trades: 2
Win:0, Loss:1, BE: 1
Loss: 31 points
1612695004085.png

Once again the downward stride is broken and this time price reverses off the halfway point of the last swing. We wait for the next low to form.
1612695383577.png

Price forms some sort of double bottom, tries to rally, but is turned away at the halfway point of the last selling wave. We take this as a retracement and enter short.
Total trades: 3
Win:0, Loss:1, BE: 1
Loss: 31 points
1612695692635.png

Price forms a lower low, attempts to rally, and is turned away at the halfway point. We move our stop to breakeven.
1612695843406.png

Price reverses and hits our breakeven stop.
Total trades: 3
Win:0, Loss:1, BE: 2
Loss: 31 points
1612696224440.png

Price drops even further but we don't see any opportunity to enter so we sit still. Price then breaks its stride, has a mini secondary reaction, and start to head up. We enter long.
Total trades: 4
Win:0, Loss:1, BE: 2
Loss: 31 points
1612696642568.png

We form a higher high and a higher low. Stop moved to breakeven.
1612696752581.png

Buying pressure falters at the halfway point of the last selling wave, but we haven't penetrated the halfway point of the buying wave so we sit tight.
1612696921161.png

Price stops a hairsbreadth away from our stop then reverses. It's now fluctuating between the halfway point of the selling wave and the buying wave.
1612697090865.png

Price then proceeds to form higher highs and higher lows. We move our stop to below the halfway point of the last buying wave.
1612697398783.png

Buying pressure then starts to falter and price breaks its stride then reverses off the secondary reaction's halfway point. We exit here.
Total trades: 4
Win:1, Loss:1, BE: 2
Loss: 31 points
Win: 100 points
1612697659417.png

Price rejects the buying wave's halfway point, sellers in control.
1612697760959.png

Price reverses again. Intermediate trend neutral.
1612697978750.png

Price takes off without us.
1612698145365.png

Looking back we could have avoided the loss if we had moved the stop loss right after the low was formed to breakeven. Not a bad outcome but there's obviously something we're missing here. We'll try again tomorrow.
 

Attachments

  • 1612695209964.png
    1612695209964.png
    124 KB · Views: 152
Ok we'll retry our reversal and retracement strategy. The difference here is that the entry will only be triggered if the overall trend is in favor of the intermediate trend, as measured through the breach of the latest wave's midpoint.
A breach is considered successful only if price can hold the break, as shown by a higher low/lower high at the break or higher/lower in the direction of the move.
Retracement prerequisites:
1. Midpoint of last wave not breached
2. Reaction at its end (either it has become neutral or control has shifted back to the previous side)
3. Higher low/lower high
Reversal prerequisites:
1. Midpoint of last wave breached
2. Price breaks its stride
Entry:
"Confirmation" of a turning point (several ways to determine this, either price has retraced more than 50% of the last move, or there are two bars with higher highs after a low (if direction is long) or two lower lows (if direction is short). This by definition would include what people call a 3 bar reversal.
Stop loss:
Below the swing low
Early exit:
Price forms a lower low/higher high (from the entry point) and the succeeding minor wave fails to retrace 100% of that move.
Exit:
1. Price breaches the 50% RET of the last wave
OR
2. Price breaks its stride, tries to continue the move, then breaches the midpoint of that failed move.

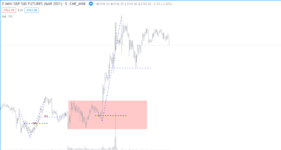
So here we start with what looks like a reversal of the downward trend, as evidenced by a breach of the midpoint of the last selling wave.
1613269538739.png

Price waffles around a bit at the top then falls back down again. We now assume that the trend is neutral, as it seems undecided whether it wants to go up or down.
1613269633564.png

Selling pressure seems light as price fails to follow through to the downside and price starts to form what looks like the beginning of an intermediate bull swing. This fulfills our criteria for a reversal and also puts the instrument's position at bullish for both intermediate and minor trend, as described by Wyckoff. We go long with a stop at x.
1613269956048.png

Price breaks its stride but remains well above the midpoint and so far doesn't show signs of failure so we sit tight.
1613270225591.png

Buying pressure fails to push price higher and the minor move's midpoint is broken. This fulfills our criteria for an early exit so we take it for a breakeven in profit.
Trades:1, Wins:0, Losses:0, BE: 1
1613270409561.png

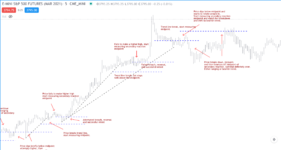
Sellers have now taken control as evidenced by the breach of the buying wave's midpoint with a successful retracement. We go short.
1613270546326.png

Selling pressure forces price to reverse and break its stride, and is now challenging the midpoint. Criteria for an early exit have not been met so we sit tight.
1613270695482.png

Successful breach of the midpoint. We close our short for a loss of 61 points. At this point looking at the preceding action we infer that selling pressure is now incapable of creating a down trend for the moment so we assume that the overall direction is up. We don't flip long immediately since we're not testing breakouts so we wait for a reaction and its end before entering long.
Trades: 2, Wins:0, Losses:1, BE:1.
1613270977666.png

Intermediate trend shifts to bearish, overall trend now unclear. We wait.
1613271239874.png

Failure to rally at the previous origin of the bull swing shows that the line of least resistance is now clearly down. A quick retracement and continuation allows us to enter a short. Since bear swings move much faster we take the first sign of the failure of the upward rally rather than wait for comprehensive failure as we would in a retracement of a bull swing.
1613271556944.png

Price reverses again and takes out our stop, for another loss of 63 points. Breakout at the selling wave's midpoint. We wait for clearer indications.
Trades: 3, Wins:0, Losses:2, BE: 1
1613271722718.png

Price rejects the halfway point and continues upwards. We enter long on the confirmed rejection.
1613271885432.png

Price breaks its stride and does a shallow retrace, then continues on its way up.
1613272007101.png

Buying pressure falters at the previous top and selling pressure forces price to retrace more than halfway the minor wave's length. We exit early for a profit of 20 points, and wait for another opportunity to go long.
Trades:4, Wins:1, Losses:2, BE:1. PnL: -6
1613272170230.png

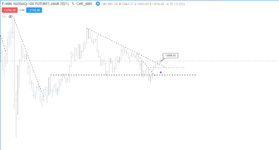
Selling pressure fails to breach the halfway point of the last buying wave, and the secondary reaction falls well short, indicating the reaction is nearing its end. As soon as the higher low is confirmed we enter long.
1613272550413.png

Which promptly gets taken out for 46 points. Zooming out we seem to be just ranging so we box out the current price area and wait.
Trades:5, Wins:1, Losses:3, BE:1, PnL: -8
1613272732163.png

A direction seems to have been decided, with a successful breach of the upper range of the trading range. We wait for a retracement.
1613272928182.png

We get this opportunity when price breaks its stride then fails to follow through to the downside.
1613273077183.png

Buying pressure once again falters and price breaks its stride then breaches the halfway point of the failed continuation. We exit for a profit of 54 points.
Trades:6, Wins:2, Losses:3, BE:1, PnL: -2
1613273299952.png

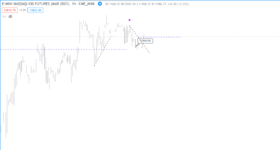
We enter long again as the bear swing fails to get close to the halfway point and the reaction seems to be at its end.
1613273389013.png

A quick acceleration makes us fan the trendline, starting a new buying wave. This is promptly broken and price decisively breaks the midpoint of this new wave, causing us to exit and prepare to go short on the retracement. Profit 78 points.
Trades:7, Wins:3:, Losses:3, BE:1, PnL: -1
1613273738111.png

The selling wave's halfway point is instead rejected and price breaks up, and we enter long.
1613273843294.png

And our stop is quickly taken out for a loss of 72 points.
Trades:8, Wins: 3, Losses: 4, BE:1, PnL: -1.6
1613274076364.png

Results aren't great. Better than the previous one but much more refinement is needed, as well as a way to identify chop, where most of the losing trades seem to have happened.
 

Attachments

  • 1613270957227.png
    1613270957227.png
    112.8 KB · Views: 136
We start our observation with the current fanned trend line broken with a strong drop, immediately followed by a re-entry into the trading range and price testing the range's upper bounds.
DnZhdFJh

Price breaches the upper bounds and promptly retests. Intermediate and minor trend are now both bullish. We enter long.
KJjxxGIf

Some selling pressure enters and stalls the advance. After a second failed attempt to take us higher we close our long for a gain of 10 points. Intermediate and minor trend neutral.
Trades:1, Wins:1.
mvEJDUTI

Renewed selling pressure then pushes price down and past the midpoint of the last buying wave. Line of least resistance now seems to be down but the intermediate trend is not confirmed as bearish yet. We wait for further developments.
k3wpO8QC

A quick reversal in the area of the previous upper bound of the range accompanied by strong volume retraces more than 100% of the selling wave's move. Intermediate and minor trend back to a bullish state. We go long here.
oK1BtdKJ

A short shift of the minor trend from bullish to neutral, before going back to bullish at point A.
74QvhE3n

Buying pressure continues to push price up until it hits a wall of supply and reverses. Intermediate trend is still bullish but the minor trend is now bearish. We exit here for a gain of 48 points.
Trades:2, Wins:2
blDnfB6H

Price drops a little bit then trades in a narrow range. Intermediate trend is bullish, minor trend is neutral. We wait for a sign that buying pressure takes charge and a few bars later we see that in the rally from the bottom of the range, shifting the minor trend to bullish. We enter long here.
ToG5S3Vh

Sudden selling pushes the price down and turns the intermediate trend neutral and the minor trend bearish. We get out at breakeven and prepare to enter short if price continues to show weakness.
Trades:3, Wins:2, BE:1
EkbS8JzJ

Price rallies a little bit less than halfway the break before a fresh wave of selling comes in. The overall trend still seems to be up but we seem to be entering a deeper correction. Intermediate and minor trend bearish. We enter short here.
JewIYNAt

Price stalls at the bottom, shifting the minor trend to neutral and putting us in doubt of the intermediate trend. A break of the minor trading range makes us shift our intermediate trend to neutral and minor trend to bullish. We exit our short for a loss of 34 points.
Trades: 4, Wins:2, Losses:1, BE:1, PnL: 1.7
qGfk3APG

Price retests the upper bounds where selling pressure increases but fails to drive price past the halfway point of the rally. Price then pushes off the halfway point. Minor trend definitely bullish, Intermediate trend also looking bullish but we want to wait for further confirmation before jumping the gun. Still, with the line of least resistance still pointing up we feel confident in entering a long here, primarily because of the attempt and failure to push price past the rally halfway point.
g9UfZTVu

Price however has other ideas and almost immediately reverses without making a new high. Intermediate trend is definitely neutral but starting to point to a bearish state, and the minor trend is now bearish. We exit here for a loss of 25 points.
Trades:5, Wins: 2, Losses: 2, BE: 1, PnL: -0.01
SFrfBy6s

Price settles into a narrow range and attempts to rally twice but fails to make any headway. On the second attempt a quick move instantly reverses it and pushes it lower. Intermediate trend bearish, minor trend bearish. We go short.
nmEVKjZY

Price falls out of the trading range but bounces strongly. We exit for a small gain of 14 points and wait to see if buying pressure is enough to overcome selling pressure.
Trades:6, Wins: 3, Losses: 2, BE: 1, PnL: 1.22
5wAQMPPB

The rally fails to hold its gains and price again starts to fall. We re-enter short here.
2egOFT0l

Selling pressure dies down and fails to push price lower. After a second attempt a strong rally pushes off the bottom causing us to exit for a loss of 37 points. Intermediate trend neutral, minor trend bullish. Line of least resistance is still down.
Trades: 7, Wins: 3, Losses: 3, BE: 1, PnL: -1.33
v3aXHLXk

Price drifts up but on narrowed spreads, indicating no real buying pressure is present. It breaches the halfway point of the reaction but fails to hold it and bounces off the trading range's midpoint, and a quick push down establishes the minor trend as bearish. Looking at the previous failed attempts to rally we also determine that the intermediate trend is bearish and we go short here.
WQsjw2FY

An abnormal spike makes us prepare to exit the short but no follow through convinces us to wait and price then starts to drift down. We exit once the rally breaks the halfway point of the selling wave for a gain of 36 points.
Trades: 8, Wins: 4, Losses: 3, BE: 1, PnL: 1.12
 
We start today's observation at the bottom of a trading range. The line of least resistance is hinting to the downside while the intermediate trend is still neutral.
S20ZEVHw

Selling pressure increases and drives price down past support where it rebounds but the rally stalls at the midpoint of the last selling wave. We assume that price will now begin a more serious decline. The line of least resistance is clearly down and the intermediate trend is now bearish. We go short here.
qjXd9Hbs

Price immediately reverses and take out our stop for a loss of 65 points. Line of least resistance is still down but the intermediate trend is neutral.
Trades:1, Losses: 1
aSrYEoDH

Price reverses again and drops below the previous swing low. Intermediate trend is bearish but we stay put until we find a good entry point to go short.
jE9Swvm6

A retest of the trading range's lower bounds gives us the opportunity that we were looking for and we go short on the rejection.
VPBwI4tZ

Once again a sudden reversal takes out our stop for a loss of 69 points. Both the line of least resistance and the intermediate trend are now neutral since the midpoint of the last selling wave has been breached and price failed to make a lower low.
Trades: 2, Losses: 2
79FAAoMz

Price makes a series of higher highs and higher lows and breaks the longer term trend line. Line of least resistance is now up and the intermediate trend is bullish. We go long on the retracement.
OZyG6COx

Price continues upwards with no breaks until it the arrival of sudden selling pressure forces a quick retrace to the midpoint of the last buying wave. Line of least resistance as well as intermediate trend is still up so we stay put but we put a stop slightly below the halfway point to protect us from a sudden drop. This happens right away and we exit for a gain of 24 points.
Trades: 3, Wins:1, Losses: 2, PnL: -5.5
BEaCzR8p

Price falls through the midpoint, retests, and is rejected. Line of least resistance is now down though intermediate trend is still neutral. However because we are also at the midpoint of the previous trading range, we go short without waiting for the intermediate trend to confirm its bearish state.
nSrByVHX

An uncontested drop makes us think that we are now entering an oversold state, and the sudden appearance of buyers at the bottom makes us cover our short prematurely without waiting for price action to confirm a reversal. We gain 167 points.
Trades: 4, Wins: 2, Losses: 2, PnL: 1.42
uCpLJR8V

Selling pressure continues uncontested until it reaches the origin of the previous upswing. Price here rallies to the halfway point, falls, then vigorously reverses to head higher. We go long at the reversal as soon as it breaches the halfway point.
Rrp9Ivri

Selling pressure forces price past the halfway point of this last rally and we get out breakeven.
Trades: 5, Wins: 2, Losses: 2, BE: 1
758lchP3

Price then rises above the halfway point, tests it, and attempts to head higher. We re-enter our long here.
LGI1Wsna

Once again abnormally high volume at the top, coupled with the fact that we are again at the midpoint of the previous trading range, forces us to close our long early without waiting for adverse price action. We close for a gain of 185 points.
Trades: 6, Wins: 3, Losses: 2, BE: 1, PnL: 2.8
noC9tmYK
 
We'll move from paper trading replays to paper trading the live market.

The selling that broke the upward trend line and that ended at point A put the intermediate trend at neutral. Buying pressure here then pushes price past the halfway point of the selling wave and we are tentatively bullish again though if price stalls here we the intermediate trend will definitely be in neutral.
GMT06Ezr

Price drops but selling pressure dries up quickly and price retraces to the midpoint of the latest buying wave. Intermediate trend is bullish and we go long here.
AsjiHCHL

Price quickly reverses putting the intermediate trend in neutral. It then attempts to rally but fails at the midpoint showing that the line of least resistance is down. Being quite close to the last support point we expect it to fail which would then shift the intermediate trend to a bearish state. We close the long for a loss of 7 points and go short.
Trades:1, Losses:1
ReragbHj

Price drops as expected, rallies to slightly more than the halfway point, then forms a mini range in that area. Intermiedate trend is neutral, line of least resistance is unclear. We cover our short here for a gain of 3 points and wait for further developments.
Trades: 2, Wins: 1, Losses: 1, PnL: -2.3
HbpEb3iN

Buying pressure pushes price all the way up to the upper edge where the previous selling wave began. Price then narrows, hinting at a reversal. If it reverses here we expect it to back near point B because it seems to have entered a trading range, giving us a gain of 27 points. Price does turn and we go short again.
vaz8W1gw

Price falls as expected but instead of closing at the bottom we decide to hold the short because of the apparent lack of interest of buyers at support.
c76xcWAx

We would keep this trade going but some household chores needed doing so we close at the bottom for a gain of 30 points.
Trades: 3, Wins: 2, Losses:1, PnL: 4.7
lbowy8M4
 
We continue from yesterday's chart. After a climax at the bottom price starts to range before showing signs of pushing to the upside. We determine this because:
1. Price is supported at the halfway point between the bottom of the previous down swing and the high of the technical rally.
2. Price has started to rejected the midpoint of the minor reaction's and is starting to pull away to the upside.
We go long here.
A1jlSBZ7


Buying pressure pushes price up then eventually forms a double top, shifting the intermediate trend into neutral. Under normal circumstances this would be enough for us to exit our long but since price is transitioning from bearish to bullish and there is a high nearby we stay put and watch for a violation of the support points. Buying pressure proceeds to push price all the way to the upper boundary of the trading range where it forms another double top. Here we exit as soon as the double top becomes clear, for a gain of 21 points.
Trades: 1, Wins: 1
e8AcWSRk

Price drops through the midpoint of the entire upswing, putting the bullish nature in doubt, and putting the intermediate trend in a bearish state. It tries to rally but is turned away at the reaction's midpoint, which happens to be in the area of the midpoint of the upswing, also putting the line of least resistance down, and we go short.
4L8hw1zz

A quick reversal brings price back to resistance, putting the intermediate trend back to neutral, then breaks to the upside. We close our short for a loss of 17 points.
Trades: 2, Wins: 1, Losses: 1, PnL: 1.23
28qosv5U

Selling pressure then overwhelms buying pressure right where we exit, and price drops as we anticipated, though we were not able to hitch a ride.
9B90eaJJ
 
Last edited:
Today we start with price having made a temporary reversal from yesterday's bullish swing. The selling wave hits previous support then retraces 100% from the last push down. Intermediate bearish, minor trend bullish. This is point A, which is also the halfway point of the entire bearish swing and so acts as the line of least resistance for the trend.

Price then acts as if it were going to drop and continue the bearish trend but instead quickly reverses and pushes past the resistance point. The intermediate trend is now, at the very minimum neutral, while the minor trend is strongly bullish, and the line of least resistance seems to be up. We anticipate a continuation of the previous upswing since the bearish trend was quite short and did not really reverse the previous advance by much. We go long here.
3t2PlUBK

Price instead immediately reverses putting the intermediate trend back into a bearish state, and the minor bullish trend is also cancelled and also bearish. We close the long for a loss of 20 points and flip short here.
Trades:1, Losses: 1
VGWa2NUp

Price plays a joke on us and stops just a little bit lower than where we entered our short, at B, then proceeds to retest the previous swing high at A before settling down at a higher level. We exit our short for a loss of 13 points.
Trades: 2, Losses: 2
vbSQuC69

Rising support points make us bullish, though we wait for a clearer indication given that this will be the last trade we make today and that we've already incurred two losses.
What we've been able to observe so far is that the violation of the midpoint and subsequent retest of previous support on the 5 min chart indicates a minor trend change in the longer-term time frame but it leaves the long-term intermediate trend unchanged. Therefore in keeping harmony with the overall trend, a "true reversal" would either be:

1) a violation of said support point (here it's the start of the last buying wave denoted by the blue dotted line), or
2) by an intermediate upward trend on the 5 min that fails to breach the previous high and reverses (this would put the intermediate trend on the long-term chart neutral), followed by a breach of the support point that started the second intermediate swing.

A continuation on the other hand would be indicated by the downward trend on the 5 min going neutral, which happens here at point B, followed by a breach of the previous swing (point A) or by a small reaction that is supported higher (the low after the high of C). Following this logic our long entry should have either been

1) after the halfway point between point A and B was breached ( aggressive entry), or
2) the low after point C, where we closed our short.

Given that we missed both, we enter on what seems to be a breakout.
pevjo18h

We close our long when price forms a double top for a gain of 7 points. We're in the red, but hopefully we've come closer to understanding how the true flow of price flows and how to stay on the trending side.
Trades:3, Wins:1, Losses: 2, PnL: -4.7
MeuupCXr

Shortly after our close price rebounds and tests the upper bounds and reacts to the midpoint. Reaction seems to be over so we go long in what is our last trade of the day.
9DKBuuZN

A short-lived advance followed by another shift to neutral clues us in to exit our long, for another loss of 7 points. We'll take today's observations to tomorrow's session and see how we do then.
Trades: 4, Wins:1, Losses: 3, PnL: -5.7
8JCpqQlF
 
Last edited:
Premarket action. Price formed a hinge and broke out to the upside, letting us draw in a new trend line. Towards the end of the session it started ranging at the top, putting the intermediate trend into neutral and stepping out of our trend line. Selling pressure seems to be lessening so we remain bullish.
n1IIuf3i

Shifting to the 5 min chart we don't really see anything of note in terms of price action or volume so we wait for the open to see how things will develop. Intermediate trend is neutral, minor trend is bearish, line of least resistance is up. Halfway of the last upswing is 14846 so we could retest that if price drops out of the range.
NrmJlZW6

Buying pressure pushes price back to the upper bounds of the small range, where price tests the midpoint briefly before rebounding. We go long here because:
1. Upward stride seems to be intact
2. No price action or volume event seems to indicate a reversal.
3. Support found at the halfway point of the last selling wave indicates that an imbalance to the bull side is now in effect.
vktTM5jh

The intermediate trend seems to be shifting to neutral but we hold the long for now, as opposed to our previous strategy of closing out as soon as this happened and perhaps even going short, since the selling wave has not reached the same length as the previous one, and there are no signs of an impending reversal, i.e. no preliminary supply as of the moment.
s7Q1sbSV

The ride seems to be over as we've made a lower high and price has now retraced past the halfway point of the last buying wave. This last buying was shorter than the previous one, and the previous one was shorter than the one before it so we don't expect a further move up without some sort of reaction first. We close out our long for a gain of 20 points.
Trades:1, Wins:1
62y6m8qn

Selling pressure pushes price down to lower bounds of the range, intermediate trend neutral, minor trend bearish. Here there is a failed attempt to go lower making the minor trend bullish. Since there have been no convincing signs of a turn, we take this sign as an opportunity to re-enter our long without waiting for the intermediate trend.
4yQyxzY6

Price rallies, retraces, then fails to make a higher high. We get out at break even.
Trades:2, Wins:1, BE: 1
dci2wZg0

Buying pressure immediately overcomes selling pressure in what seems to have been a test. Price rallies back to the median set by the selling wave that broke the previous intermediate bullish trend and sits there for a while before taking off from there. We try again on the long side because we still don't see any signs of a serious setback for buyers. It's not the best position since we're in the middle of a trading range but the price action has narrowed indicating that the move should be directional.
lVEwYya5

Price rallies all the way to the upper edge then comes back down to the midpoint. We exit as soon as we see that it starts to break through, for a loss of 8 points.
Trades: 3, Wins: 1, Losses:1, BE:1, PnL: 2.5
ZDhIZfo4

10 minutes later we get a reversal in the same area, with what seems like more active participation. The higher low makes the intermediate trend bullish. We put in our last trade of the day and go long once again.
662KBTRV

Buying pressure manages to push price up again to the upper edge but falters and starts to retrace more than halfway. We exit for a small gain of 2 points.
Trades:4, Wins: 2, Losses: 1, BE: 1, PnL: 3
ad5egeXZ

Reviewing the action here we probably should have stopped after the second trade when it was clear that there wasn't enough buying pressure to continue the move, but no selling pressure either.
 
Hi Morina, you mention your trading is based on Wykoff's work, I believe this is based around volume isnt it? if so, could you recommend any of the books?

Thanks
Sean
 
Hi Morina, you mention your trading is based on Wykoff's work, I believe this is based around volume isnt it? if so, could you recommend any of the books?

Thanks
Sean
Hi @srm888

Wyckoff's approach is based on supply and demand, and so by definition volume must be taken into account, but it's only one component of his approach. You need to look at what price did with that volume. Wyckoff placed a lot of importance on support, resistance, duration and distance of the buying and selling waves, etc.

The only book I can really recommend is Wyckoff's own work. It's called The Richard D. Wyckoff method of trading and investing in stocks: A course of instruction in stock market science and technique. There are a few copies floating around on the internet.

You can also browse around the threads and posts by @dbphoenix . He's by far the most knowledgeable and experienced Wyckoff trader I know, in Wyckoff's original approach. A lot of people used a modified Wyckoff approach, which is where the common Wyckoff schematic comes from. I don't know so much about that since I try to stick to the source material.
 

Attachments

  • Screen Shot 2021-06-03 at 9.53.36 AM.png
    Screen Shot 2021-06-03 at 9.53.36 AM.png
    479.8 KB · Views: 124
Last edited:
Top