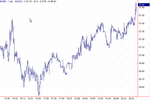
At present I am working off of 3 chart timescales the 5 and 15 minute and to a lesser extent the 1 min chart.
I tend to favour the 5 minute chart and look to supporting pivots from a closing line chart with Bollinger Bands and a 4 period SMA. I use the same settings on the 15 minute chart except that I have a 2 period SMA.
Personally I would prefer to work from a 3 and 10 minute chart but I am currently working with CMC charts but intend to move over to esignal. I find the 1 minute provide to many false signals and the 15 minute can be to long so a balance maybe provided by the 3 and 10.
Anyway my question for those of you out there that daytrade watching the charts and price closely. How do you approach a situation where it appears a signal to buy or sell presents itself during the current period where the chart is yet to be updated.
In other words there appears within the 5 minutes tick a possible higher lower pivot appearing on the line chart as the price passes the previous 5 minute close. Is this sufficient to support your entry or is it a case of holding on to see this movement confirmed with a plotted closing position. I have to say that often the price tumbles further having given such a signal. This is a particular problem for me when applying it to the 15 minute chart looking for reversal points. By applying the supporting pivot approach on the 5 minute chart I do rather well and there are a lot of signals throughout the day, obviously using this method on the 15 minute chart the deals are rather restricted but offer bigger gains. If you include the intraday price cycle reversals on the 15 minute chart then there tend to be around 5 -7 good deals a day, if you get the reversal right that is.
Would be interested in any views
regards Kevin


