You are using an out of date browser. It may not display this or other websites correctly.
You should upgrade or use an alternative browser.
You should upgrade or use an alternative browser.
Here you can find stocks matching the stan weinstein system:
Mansfield Relative Strength > 0; Price > SMA30; SMA30 is upwards
or
Mansfield Relative Strength < 0; Price < SMA30; SMA30 is downwards
World market index: http://indexcfd.com/
U.S. Sectors: http://indexcfd.com/us-sector/
U.S. Dow 30: http://indexcfd.com/us-dow30/
U.S. Nasdaq 100: http://indexcfd.com/us-nasdaq100/
U.S. S&P 500: http://indexcfd.com/us-sp500/
Also France, Spain and other countries...
isatrader
Senior member
- Messages
- 2,965
- Likes
- 136
Major US Stock Indexes Update - NYSE, Nasdaq, S&P 500 & DJIA
Sorry I haven't been on here for a while. The scope of the method was too much for an individual thread anymore so I created a separate website for it a few years back here: https://stageanalysis.net/forum/index.php so that people can learn the method and discuss it in more detail, and there are now thousands of posts and marked up charts etc.
So all the recent questions have already previously been asked and answered on the website if you still need help.
Back to the task at hand. Here's the overview charts of the US Bullish Percent and Moving Average Breadth.
NOTE: the breadth continues to gradually weaken overall, although still in the bullish ranges. So nothing serious to note yet from the charts, but the S&P 500, Dow 30 and NYSE markets haven't followed the Nasdaq Composite to fresh continuations. So it is giving me some pause about the market health.
So taking into account the market breadth positions, I'm going to change my Stage rating for the US market to Stage 2B.
Attachments
joyman1710
Newbie
- Messages
- 1
- Likes
- 0
Relative strength in Amibroker
Could you please write this formula in Amibroker program? Thanks so much
One of the core components of Stan Weinstein's method is the use of Relative Performance compared to an index such as the S&P 500, to a sector or to another stock. Which was referred to in his book as Relative Strength.
However, this should not to be confused with the popular RSI (Relative Strength Index developed J. Welles Wilder), which is a momentum oscillator that measures the speed and change of price movements on a single stock. And so, to avoid any confusion when talking about the kind of Relative Strength we are interested in, I've renamed to be "Relative Performance".
Weinstein defines it as the following on page 18 of the book:
Relative Performance Indicators
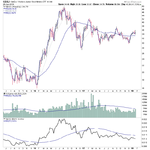
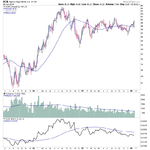
On here I have two ways of representing the Relative Performance on a chart. The first version I show is the representation that people are used to from the book (#1 on the below chart) which is the Mansfield Relative Strength Indicator. The second version that I show immediately below (#2 on the below chart) is the standard relative performance line that you get if you divide the closing price of the stock by the index that you want to reference, which in the majority of cases will be the S&P 500 Index unless otherwise stated.
So as you can see, these two indicators are identical, however, they show the Relative Performance data in slightly different ways, which I personally find useful to see. For example, the "zero line" on the Mansfield version is a flattened 52 week moving average which shows the data more like an oscillator and so is easier to see when it reaches extremes. However, on the standard relative performance line the slope of the 52 week moving average (zero line) can be seen, which can give further clues to the relative performance of the stock versus the index on a longer term basis.
Below is a weekly chart of Apple (AAPL) showing the two versions of the Relative Performance Indicator versus the S&P 500 Index.

Standard Relative Performance indicator
The formula for calculating standard relative performance indicator is quite simple:
Code:RP = ( stock_close / index_close ) * 100
And then a 52 week moving average is added to the indicator to show the zero line.
So the longer version is:
Standard Relative Performance = (today's close of the stock divided by today's close of the index) * 100
Mansfield Relative Performance indicator
The formula of this indicator is a bit more difficult than the regular Standard Relative Performance indicator:
Code:MRP = (( RP(today) / sma(RP(today), n)) - 1 ) * 100
Where:
RP = Standard Relative Performance indicator (see above)
SMA = Simple moving average over n days.
n = 52 for weekly charts, and n = 200 on daily charts
So to make it a bit clearer:
Mansfield Relative Performance = (( Today's Standard Relative Performance divided by Today's Standard Relative Performance 52 Week Moving Average )) - 1) * 100
I hope the above calculations all make sense, but if you need further assistance then chartmill.com did a good article on it which you can find here: ChartMill.Com | Articles on Technical Analysis Indicators and Screeners
Could you please write this formula in Amibroker program? Thanks so much
isatrader
Senior member
- Messages
- 2,965
- Likes
- 136
Mansfield Relative Performance Indicator
Hi joyman1710, you can find the code for creating the Mansfield Relative Performance Indicator on amibroker and some other charting programs too in the How to create the Mansfield Relative Performance Indicator thread on the Stage Analysis forum here: https://stageanalysis.net/forum/showthread.php?tid=31&pid=8865#pid8865
Hope that helps.
Could you please write this formula in Amibroker program? Thanks so much
Hi joyman1710, you can find the code for creating the Mansfield Relative Performance Indicator on amibroker and some other charting programs too in the How to create the Mansfield Relative Performance Indicator thread on the Stage Analysis forum here: https://stageanalysis.net/forum/showthread.php?tid=31&pid=8865#pid8865
Hope that helps.
isatrader
Senior member
- Messages
- 2,965
- Likes
- 136
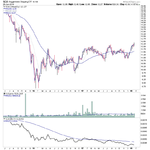
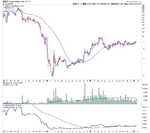
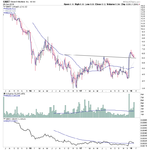
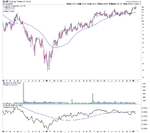
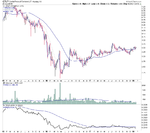
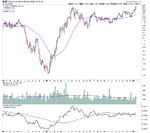
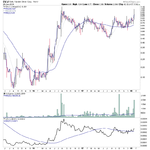
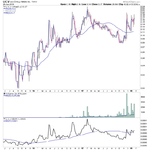
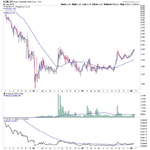
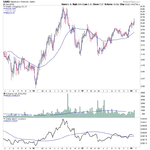
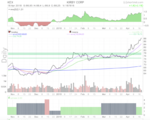
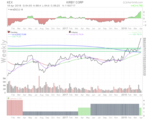
Sector focus: Marine Transportation
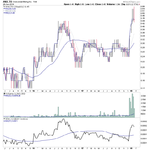
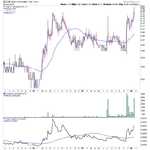
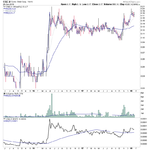
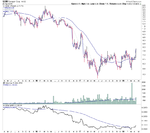
An area that I'm interested in doing more research at the moment is the Marine transportation sector. Currently sixth strongest over the last month, and with a large amount of very large Stage 1 bases, and weekly chart volatility contraction patterns over many months. Many stocks have appeared over the last month in my scans, and the sector ETF SEA made a small Stage 2A breakout this week. So I think it's a very interesting sector and worth further research.
Here's are some of the interesting stocks imo.
SBLK, GNRT, GOGL, GNK, SALT, EURN, SB, GLOP, CPCL, NMM
Attachments
-
 SEA_W_26-1-18.png27 KB · Views: 394
 -
 SALT_W_26-1-18.png26.9 KB · Views: 380
 -
 GNK_W_26-1-18.png25 KB · Views: 407
 -
 GOGL_W_26-1-18.png25.6 KB · Views: 433
 -
 GNRT_W_26-1-18.png26.6 KB · Views: 428
 -
 SBLK_W_26-1-18.png27.6 KB · Views: 450
 -
 EURN_W_26-1-18.png32.9 KB · Views: 390
 -
 SB_W_26-1-18.png28.7 KB · Views: 378
 -
 GLOP_W_26-1-18.png29.2 KB · Views: 415
 -
 CPLP_W_26-1-18.png27.8 KB · Views: 364
 -
 NMM_W_26-1-18.png26 KB · Views: 418
isatrader
Senior member
- Messages
- 2,965
- Likes
- 136
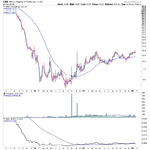
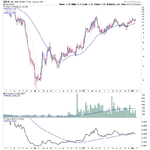
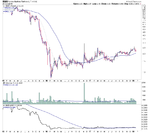
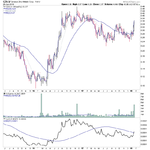
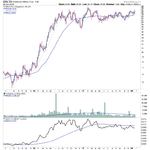
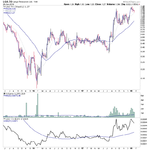
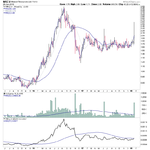
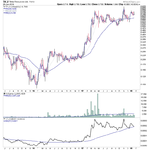
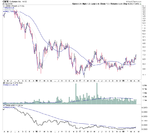
Sector focus: Gold Miners (part 1 of 3)
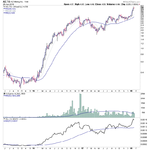
Gold and Gold Miners are another area of interest currently, with the spot gold chart near the top of it's range on the weekly chart, and the potential for a monthly Stage 2A breakout.
Gold and Gold Miners are another area of interest currently, with the spot gold chart near the top of it's range on the weekly chart, and the potential for a monthly Stage 2A breakout.
Attachments
isatrader
Senior member
- Messages
- 2,965
- Likes
- 136
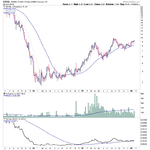
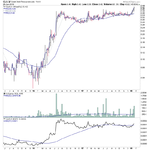
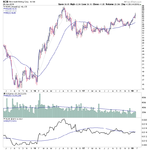
Sector focus: Gold Miners (part 2 of 3)
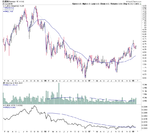
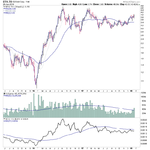
If we do see a new Stage 2 breakout then history suggests that the gold miners are a leveraged way to play it, especially the junior miners, which can have very big moves. So I've gone through the gold miners charts in the US and Canada to look for the stocks getting strong volume increases and that are in good shape for a potential move or already moving.
AEM, ANX.TO, AZ.TO, BTO.TO, BVN, CGE.V, CLE.V, CLH.V, CZX.V, DV.V, EDV.TO, FOM.TO
Attachments
-
 AEM_W_26-1-18.png29.6 KB · Views: 411
 -
 ANX-TO_W_26-1-18.png28.8 KB · Views: 381
 -
 AZ-TO_W_26-1-18.png24 KB · Views: 417
 -
 BTO-TO_W_26-1-18.png27.9 KB · Views: 392
 -
 BVN_W_26-1-18.png31.2 KB · Views: 373
 -
 DV-V_W_26-1-18.png30.1 KB · Views: 410
 -
 CZX-V_W_26-1-18.png30 KB · Views: 369
 -
 CLH-V_W_26-1-18.png26.2 KB · Views: 380
 -
 CLE-V_W_26-1-18.png28.8 KB · Views: 379
 -
 CGE-V_W_26-1-18.png29.3 KB · Views: 392
 -
 EDV-TO_W_26-1-18.png25.5 KB · Views: 377
 -
 FOM-TO_W_26-1-18.png28.4 KB · Views: 411
isatrader
Senior member
- Messages
- 2,965
- Likes
- 136
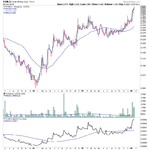
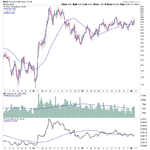
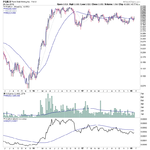
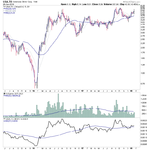
Sector focus: Gold Miners (part 3 of 3)
Gold miners: part 3
GCM.TO, GBR.V, KGC, LGO.TO, LIC.V, MRZ.V, NEM, PGM.V, SAND, TK.V, TV,TO, USA.TO
Gold miners: part 3
GCM.TO, GBR.V, KGC, LGO.TO, LIC.V, MRZ.V, NEM, PGM.V, SAND, TK.V, TV,TO, USA.TO
Attachments
-
 LIC-V_W_26-1-18.png29.8 KB · Views: 422
 -
 LGO-TO_W_26-1-18.png29.9 KB · Views: 437
 -
 KGC_W_26-1-18.png30.3 KB · Views: 398
 -
 GBR-V_W_26-1-18.png26 KB · Views: 383
 -
 GCM-TO_W_26-1-18.png25.6 KB · Views: 371
 -
 MRZ-V_W_26-1-18.png28.1 KB · Views: 373
 -
 NEM_W_26-1-18.png29.1 KB · Views: 403
 -
 PGM-V_W_26-1-18.png28.5 KB · Views: 364
 -
 SAND_W_26-1-18.png30.6 KB · Views: 379
 -
 TK-V_W_26-1-18.png26.7 KB · Views: 378
 -
 USA-TO_W_26-1-18.png28.1 KB · Views: 393
 -
 TV-TO_W_26-1-18.png29.9 KB · Views: 366
isatrader
Senior member
- Messages
- 2,965
- Likes
- 136
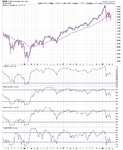
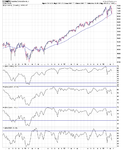
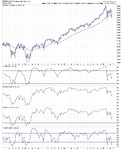
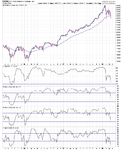
Major US Stock Indexes Update - NYSE, Nasdaq, S&P 500, DJIA & S&P 600 small caps
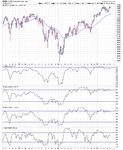
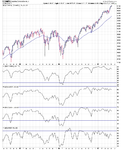
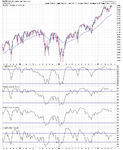
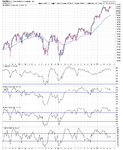
Here's the overview charts of the US Bullish Percent and Moving Average Breadth.
Note: Stage 3 is showing in all the major US markets now. Keep an eye on our leading breadth indicators, especially the Percentage of Stocks above their 150 day MAs in the various US markets which currently stand around the low 40% mark, which is the lowest level for years. So something I'll be keeping an eye on.
Attachments
Last edited:
isatrader
Senior member
- Messages
- 2,965
- Likes
- 136
NYSE Market Breadth Update
Attached is the NYSE Bullish Percent Index and the NYSE long, medium and short term moving average breadth charts.
The NYSE Bullish Percent Index
Note: Bear correction status


NYSE Percentage of Stocks above their 200 Day, 150 Day and 50 Day Moving Averages P&F charts
Note: 200, 150 and 50 day charts have moved back to Bear confirmed status


NYSE Percentage of Stocks above their 200 Day, 150 Day and 50 Day Moving Averages line charts


Attached is the NYSE Bullish Percent Index and the NYSE long, medium and short term moving average breadth charts.
The NYSE Bullish Percent Index
Note: Bear correction status
NYSE Percentage of Stocks above their 200 Day, 150 Day and 50 Day Moving Averages P&F charts
Note: 200, 150 and 50 day charts have moved back to Bear confirmed status
NYSE Percentage of Stocks above their 200 Day, 150 Day and 50 Day Moving Averages line charts
isatrader
Senior member
- Messages
- 2,965
- Likes
- 136
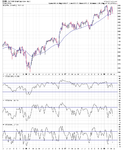
NYSE Advance Decline Breadth Charts and New Highs - New Lows Charts
Attached is the updated Advance Decline Breadth Charts, including the cumulative AD line, momentum index, cumulative AD volume line, 10 Day AD oscillator and the McClellan Oscillator and Summation Index.


US New Highs / New Lows charts.


Here's an overview of what I'm seeing in the breadth charts overall.
NYSE Bullish Percent: 52.76% - Bear Correction Status
NYSE Percentage of stocks above their 200 day MAs: 43.44% - Bear Confirmed status
NYSE Percentage of stocks above their 150 day MAs: 36.38% - Bear Confirmed status
NYSE Percentage of stocks above their 50 day MAs: 22.12% - Bear Confirmed status (oversold range)
NYSE Momentum Index: Testing the breakdown level.
NYSE Advance Decline Cumulative: Below a now declining 50 week MA. Made lower high recently. Not yet below February low though.
NYSE Advance Decline Cumulative 10 and 30 week EMAs: Negative crossover following lower high. Bearish.
NYSE Advance Decline 10 Day MA Oscillator: Approaching February low levels. Oversold zone in short term.
US New Highs - New Lows (5 day average): Below zero line again, and making new low, but still well above February low currently. So although negative, could also be a positive divergence if it doesn't get much worse, and price action rebounds at the test of the February lows.
US New Highs - New Lows Cumulative: Price just crossing below the 50 week MA for the first time since uptrend begain in 2016. And 50 day MA momentum breaking down below 2016 swing low. Approaching zero line.
Attached is the updated Advance Decline Breadth Charts, including the cumulative AD line, momentum index, cumulative AD volume line, 10 Day AD oscillator and the McClellan Oscillator and Summation Index.
US New Highs / New Lows charts.
Here's an overview of what I'm seeing in the breadth charts overall.
NYSE Bullish Percent: 52.76% - Bear Correction Status
NYSE Percentage of stocks above their 200 day MAs: 43.44% - Bear Confirmed status
NYSE Percentage of stocks above their 150 day MAs: 36.38% - Bear Confirmed status
NYSE Percentage of stocks above their 50 day MAs: 22.12% - Bear Confirmed status (oversold range)
NYSE Momentum Index: Testing the breakdown level.
NYSE Advance Decline Cumulative: Below a now declining 50 week MA. Made lower high recently. Not yet below February low though.
NYSE Advance Decline Cumulative 10 and 30 week EMAs: Negative crossover following lower high. Bearish.
NYSE Advance Decline 10 Day MA Oscillator: Approaching February low levels. Oversold zone in short term.
US New Highs - New Lows (5 day average): Below zero line again, and making new low, but still well above February low currently. So although negative, could also be a positive divergence if it doesn't get much worse, and price action rebounds at the test of the February lows.
US New Highs - New Lows Cumulative: Price just crossing below the 50 week MA for the first time since uptrend begain in 2016. And 50 day MA momentum breaking down below 2016 swing low. Approaching zero line.
mpups
Experienced member
- Messages
- 1,022
- Likes
- 144
Attached is the NYSE Bullish Percent Index and the NYSE long, medium and short term moving average breadth charts.
The NYSE Bullish Percent Index
Note: Bear correction status
View attachment 250908View attachment 250918
NYSE Percentage of Stocks above their 200 Day, 150 Day and 50 Day Moving Averages P&F charts
Note: 200, 150 and 50 day charts have moved back to Bear confirmed status
View attachment 250910View attachment 250912View attachment 250914
NYSE Percentage of Stocks above their 200 Day, 150 Day and 50 Day Moving Averages line charts
View attachment 250916View attachment 250920View attachment 250922
i had not heard of these "NYSE Percentage of Stocks above" indicators before, thank you
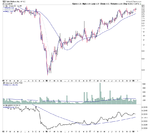
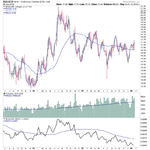
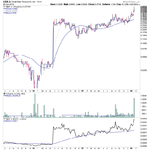
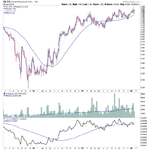
Hi Isatrader, Your previous post on Marine Transport is interesting...
It seems that Kirby Corp. (KEX) is in stage 2... not sure if a or whatever..
what do you all think?
It seems that Kirby Corp. (KEX) is in stage 2... not sure if a or whatever..
what do you all think?
Attachments
isatrader
Senior member
- Messages
- 2,965
- Likes
- 136
Kex
Hi canikram,
Yes, KEX made a Stage 2 continuation breakout a few weeks back, and was highlighted in the US watchlist thread on the 5th April here: https://stageanalysis.net/forum/showthread.php?tid=14&pid=11913#pid11913
A few others have come up in the last few weeks including SSW and CMRE in Fridays scans, as both are attempting Stage 2A breakouts. However, neither meets the methods 2 times the last 4 weeks average volume requirement yet, but it is a good sign that there are multiple breakouts in the sector. But we need to see more volume coming into the stocks in the sector like is pouring into the oil stocks currently.
Hi Isatrader, Your previous post on Marine Transport is interesting...
It seems that Kirby Corp. (KEX) is in stage 2... not sure if a or whatever..
what do you all think?
Hi canikram,
Yes, KEX made a Stage 2 continuation breakout a few weeks back, and was highlighted in the US watchlist thread on the 5th April here: https://stageanalysis.net/forum/showthread.php?tid=14&pid=11913#pid11913
A few others have come up in the last few weeks including SSW and CMRE in Fridays scans, as both are attempting Stage 2A breakouts. However, neither meets the methods 2 times the last 4 weeks average volume requirement yet, but it is a good sign that there are multiple breakouts in the sector. But we need to see more volume coming into the stocks in the sector like is pouring into the oil stocks currently.
Attachments
soundmanshane
Junior member
- Messages
- 26
- Likes
- 0
Thanks for this, some of it's really useful. I've been helped to develop my own strategy which follows some on Weinstein methodologies, I see some similar stocks showing up, but I believe my method gets into the trend at a later stage.
tradingolives
Newbie
- Messages
- 1
- Likes
- 0
New to this forum.
I am looking to see if how to set up the Mansfield relative performance indicator in thinkorSwim TOS?
I am looking to see if how to set up the Mansfield relative performance indicator in thinkorSwim TOS?
Daddybyday
Junior member
- Messages
- 34
- Likes
- 5
Hello, All,
New to both this forum and this board. Just been introduced to Weinstein, have ordered the book, and look forward to receiving it tomorrow. I'm sure I'll have lots of questions to ask (sorry, I"m not shy about that), but I'm pretty excited about learning Stage Analysis. It seems to be about what I'm looking for investing-wise, and why I came to this forum in the first place.
Thanks!
Tom
Daddybyday
Junior member
- Messages
- 34
- Likes
- 5
First annoying question (and I haven't even read the book yet) (I did warn y'all). I'm reading about Weinstein on "Investopedia" and they talk about short-selling in stage 4. Has anyone used Put Options during stage 4 (I'm in a retirement account and can't short sell, but I can go long both calls and puts). I just wanted to see if anyone has, and how it went.
Thanks!
Tom
Thanks!
Tom
Similar threads
- Replies
- 2
- Views
- 5K
- Replies
- 170
- Views
- 31K
- Replies
- 9
- Views
- 17K
- Replies
- 0
- Views
- 2K