You are using an out of date browser. It may not display this or other websites correctly.
You should upgrade or use an alternative browser.
You should upgrade or use an alternative browser.
neil
Legendary member
- Messages
- 5,169
- Likes
- 754
Hi gdiddy, a belated welcome to you and thank you for your kind words. I appreciate it.
That sounds interesting about the book. If it's only a small sample, then I think we might get away with posting Weinstein's section of it on here as it's fairly obscure and long out of print. As, if anyone has a problem with it being posted then t2w can remove it. So if you scan it then and then save it as a pdf, then you can post it as an attachment. Or if it's just images save as .png or as a .gif if you can to keep the file sizes of the pages down.
Weinstein is well worth the read👍
isatrader
Senior member
- Messages
- 2,965
- Likes
- 136
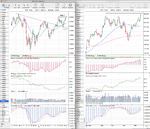
Interesting development, in that the broad NYSE chart (NYA) of all stocks in the New York Stock Exchange is testing the top of it's Stage 3 range that's developed over the last 3 months and also the US 30 Treasuries has hit the breakdown level I was watching for potentially moving into Stage 4A. The major swing low at the bottom of the support zone to watch is 144.47 from September. But the more recent swing low was broken just today, so it's turning out to be an interesting week so far.
Attachments
Last edited:
goodtyneguy
Active member
- Messages
- 146
- Likes
- 9
It looks to me like Italy and Spain are threatening to be in a stage 2A by the end of the week.
I know the stock markets discount the future but with the amount of private sector debt still at elevated levels I find it hard to believe that the US indices will go onto make new highs anytime soon. Similarly with the european indices that are in a stage 2A (Austria) or are threatening to be (Italy and Spain), I am tending to think that these will end up back in the basing pattern.
Having said that, perhaps the big players are switching capital out of sovereign debt in favour of stocks on the basis that stocks are safer than government debt?
Last edited:
theblackmamba
Active member
- Messages
- 106
- Likes
- 3
isatrader
Senior member
- Messages
- 2,965
- Likes
- 136
Attached is Stan's interview from Technically Speaking. Enjoy!!
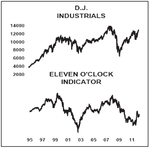
Excellent work gdiddy, this is a really outstanding contribution to the thread with some new information on some of his primary indicators like for example how to calculate the "eleven o'clock" indicator and also his "speculation index" - which is the weekly volume of the Nasdaq divided by the weekly volume of the NYSE.
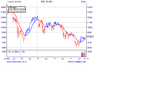
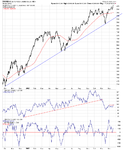
I've had a look at the GTA report to compare it to a more recent example of the speculation index and it says the data is smoothed out with a 4 week moving average. I've attached the "speculation index" below, but I'm not convinced of it's use personally as it's just showing that speculation is continuing to grow to new all time highs.
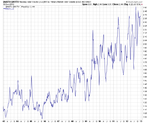
The eleven o'clock indicator will take some manual work to create as it's simply a cumulative chart of the difference between the eleven o'clock and noon level of the Dow Jones Industrial Average. Below is the example of it from the GTA report so you can get an idea of what it looks like over the years.
Attachments
Last edited:
isatrader
Senior member
- Messages
- 2,965
- Likes
- 136
I've had one full read through of the interview from "Technically Speaking" with Stan and there's a lot of useful information in there that covers some of the grey areas from the book that we've debated on here over the last year. One section in particular on page 433 is worth writing out as it's a grey area we've talked about a lot:
Q: When you spot a stock breaking out of a base and moving from Stage 1 to Stage 2, how do you distinguish between a stock making a false breakout and the start of a true, legitimate uptrend?
A: "First of all, you really can't totally until after the fact, but we can at least have a hint into which one is more likely. If the volume doesn't pick up considerably, you have a big chance of a false breakout."
Q: Should we expect average daily volume to double?
A: "At minimum a double. Historically, if you go back the big winners have at least triple volume on the daily charts. I would say you are very unlikely to get a false breakout if you have double volume on a weekly chart and triple on a daily chart. The other thing that will help keep the false breakouts down is to make it close above the breakout. If you can give me these two things at the end of the day it would cut down the chance of a false breakout. Let's say a stock broke out at 20 1/8, went up to 20 1/2 and closed at 19 7/8 and the volume didn't pick up. The odds, and that's all we are dealing with is probabilities, are that this could be a false breakout if you get this type of thing. I don't like to buy a stock at 9:42 in the morning. I like to see how it's going to close at the end of the day."
Q: So you want a stock to close at its intraday high when it breaks out?
A: "It doesn't necessarily have to close at it's daily high but it has to close above the breakout. If the breakout was at 20 1/8, it should close above that. The higher in the day the better."
So that portion of the interview clarifies what I've taken from the GTA samples, in that the buy stop approach from the book was ditched, and you are nowadays looking for a close above the breakout level with at least a daily doubling of volume, and a close high in the days range to give you the best odds of a successful breakout. So you shouldn't be doing any buying of Stage 2A breakouts until very late in the day - probably the last 15 minutes or so to make sure these criteria are met. But you still need to consider risk reward tolerances, which is talked about later in the interview.
Last edited:
I'm glad you posted that part of the interview because I had also caught notice of that when I first read it. On some of the breakout trades that I've been burned on, I made the mistake of buying early in the day (before 10:00 or 11:00 AM) and not having volume confirm. Usually you can extrapolate out into the day whether volume will be significant. If a stock's average daily volume is 5 mm shares and it has already traded 4 mm shares by 11:00 AM, then odds are volume will be substantially above average by the end of the day. And those are usually the stocks that maintain their breakout. The ones that still fail may end up as such because of low liquidity (one big sell order can knock down the price significantly, so I pay attention to B/A spreads and shy away from very low volume stocks).
Also, it's difficult to buy breakouts that close in the upper end of the trading range because that upper end may be too far from the breakout point (which is now support) and you can end up overpaying.
I think buying on pullbacks is a safer strategy simply because you have time to evaluate both volume on the breakout and on the pullback in price. Limit orders work great in this regard.
theblackmamba
Active member
- Messages
- 106
- Likes
- 3
agreed excellent article..thanks for posting....the key thing that sprung to me was when he was talking about constructing trendlines and keeping them simple..if you can;t see it its not there...that applies to all charts not nec trendlines, and on any timeframe, or wether using weinstein or not....ifyou have to look hard for the setup its not there..look for the setups that jump out...
as said last night was going to start buying spain, so bought the index, and iberdrola, gamesa, both imohave good chart patterns..not necessarily weinsteiners, but similar...
as said last night was going to start buying spain, so bought the index, and iberdrola, gamesa, both imohave good chart patterns..not necessarily weinsteiners, but similar...
isatrader
Senior member
- Messages
- 2,965
- Likes
- 136
I think buying on pullbacks is a safer strategy simply because you have time to evaluate both volume on the breakout and on the pullback in price. Limit orders work great in this regard.
While true it's a safer strategy, the A+ big winners don't ever pullback to the breakout level. So you are sacrificing the best stocks if you don't buy at the initial 2A breakout point. Weinstein's solution to this to minimise risk is that you should only buy half a position size at the initial Stage 2A breakout point.
Also something we've talked about in the past is that the 2A breakout point is suited to investors looking to hold the stock for a year or more, whereas traders should focus more on continuation breakouts already in early Stage 2, or to new highs above a failed Stage 3 range.
isatrader
Senior member
- Messages
- 2,965
- Likes
- 136
No there hasn't been any refinements to the "When to Sell" strategy that Weinstein describes in his book.
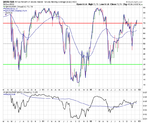
Back to the interview from the Technically Speaking book. Another area that I want to highlight is on page 439 where he talks about his proprietary indicator - the NYSE Survey (This has now been split into two charts and is called the S&P Survey and the Secondary Survey.) The interviewer asks how correlated the NYSE Survey is to the Investor's Intelligence percentage of NYSE stocks above their moving average line? Which is the NYSE Percent of Stocks Above their 150 Day Moving Average ($NYA150R) chart and can be found for free on stockcharts here: $NYA150R - SharpCharts Workbench - StockCharts.com
Weinstein says there is a definite correlation of roughly 75% to 80%, but believes his gauge is finer tuned for various reasons. But as we don't have access to his proprietary NYSE Survey, an 80% correlation is a good enough substitute, especially as he rates the two most important indicators as the NYSE Survey and the advance/decline line. So we can replace the NYSE Survey with the NYSE Percent of Stocks Above their 150 Day Moving Average breadth chart with a reasonable level of confidence.
Attachments
Last edited:
Not sure if this has been posted, but I searched the thread and I don't think it has. Here is Stan in all his glory being interviewed on the day of the stock market crash in 1987. Stan was routine guest on the Nightly Business Report (Paul Kangas, the interviewer, I believe was stationed out of Miami, so it's not a surprise that Stan was in studio during his interviews).
The interview starts after the 4:00 mark:
Black Monday - Part 2 - Nightly Business Report Oct.19, 1987 - YouTube
The interview starts after the 4:00 mark:
Black Monday - Part 2 - Nightly Business Report Oct.19, 1987 - YouTube
isatrader
Senior member
- Messages
- 2,965
- Likes
- 136
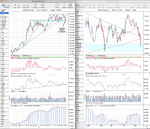
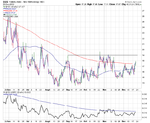
Attached is the EURUSD weekly and daily chart. It's moved into Stage 2A this week, but only on very light volume and it also has near term resistance from early this year. So I'd only rate it a C- breakout personally as its not fulfilling the all of the methods main requirements.
gdiddy, the 1987 interview was posted on the thread late last year, but things get hard to find so thanks for posting it again as more recent members might have missed it.
Weinstein has done four 20 minute interviews on the Financial Sense website since November 2011, which have been posted on here as they've appeared. Here is the link to the Financial Sense archive page though, with all four of the interviews, for those that have missed them. http://www.financialsense.com/contributors/stan-weinstein
Attachments
Last edited:
isatrader
Senior member
- Messages
- 2,965
- Likes
- 136
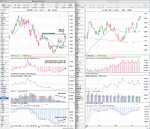
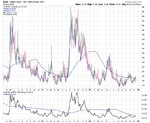
The Volatility Index (VIX) caught my eye today as it closed back above it's 200 day MA on the daily chart and moved into Stage 1B. The 200 day MA has flattened out and the 50 day MA has been rising slowly since late October. Relative Performance versus the S&P 500 is also rising and is close to zero line. So a close above 19 would be the 2A breakout point imo, and is not far away, so is something to watch very carefully. Attached is the daily and weekly charts.
Attachments
goodtyneguy
Active member
- Messages
- 146
- Likes
- 9
Thanks for the uploads gdiddy, and thanks ISAtrader for the link to the financial sense interviews. Some good holiday reading and listening in store for me.
Gold and silver have taken a big hit dropping below their 30 week ma's over the past few days! We'll probably have to wait until the new year before we see any real action in the rest of the major markets. A momentous year may well be on the cards.
Oh, how do you get volume on the eur/usd pair ISA?
Gold and silver have taken a big hit dropping below their 30 week ma's over the past few days! We'll probably have to wait until the new year before we see any real action in the rest of the major markets. A momentous year may well be on the cards.
Oh, how do you get volume on the eur/usd pair ISA?
isatrader
Senior member
- Messages
- 2,965
- Likes
- 136
Thanks for the uploads gdiddy, and thanks ISAtrader for the link to the financial sense interviews. Some good holiday reading and listening in store for me.
Gold and silver have taken a big hit dropping below their 30 week ma's over the past few days! We'll probably have to wait until the new year before we see any real action in the rest of the major markets. A momentous year may well be on the cards.
Oh, how do you get volume on the eur/usd pair ISA?
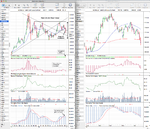
Gold broke through the Stage 4A breakdown point that I highlighted last week in the Stage Analysis I did. Silver too. Attached is the updated chart with the swing target.
The overnight action price action in the US indexes from the failed vote, could push the VIX chart above it's 2A breakout level at 19 today, as was quite a violent move.
I get my forex data via ADVFN, who use GTIS Forex - Real Time Foreign Exchange Rates. They get nearly 200 global bank and broker contributions (Asia / Pacific Rim, Russia, Europe and North America) to the data, which I'm assuming is where they calculate the volume from. It says on the Esignal site that forex data from GTIS (best bid / ask by contributor), the primary supplier, for more than 20 years, of foreign exchange information used by traders, corporations and financial institutions.
Attachments
This thread is the reason why I signed up in this forum. No matter what trading strategies I've tried in the past, I've always found myself returning to Stan's simple, no-nonsense strategies outlined in his book. His Financial Sense interviews are great--I've listened to each of those interviews several times because I try to reinforce his main points. I wish I could dig up interviews he has done on NBR and with Gary Kaltbaum many moons ago. The guy is a market sage.
isatrader
Senior member
- Messages
- 2,965
- Likes
- 136
This thread is the reason why I signed up in this forum. No matter what trading strategies I've tried in the past, I've always found myself returning to Stan's simple, no-nonsense strategies outlined in his book. His Financial Sense interviews are great--I've listened to each of those interviews several times because I try to reinforce his main points. I wish I could dig up interviews he has done on NBR and with Gary Kaltbaum many moons ago. The guy is a market sage.
Thanks gdiddy, I'm glad you liking the thread and agree about Weinstein's simple but effective approach. My hypothesis when I began researching Weinstein's method was that there must be something to it, as it had survived with very little changes for almost 25 years since the book was published, and his GTA newsletter and consultation service had become only accessible to institutional level investors with $60k a year to spend. I'm still continuing my study of it, but my conclusion so far is that it does increase your probabilities of success if you follow it correctly. As as he said in his interviews, simply never going long or holding on to Stage 4 stocks anymore will give you an advantage in this game.
With regards to the Financial Sense interviews. I know he says at the end of the most recent ones not to contact him if you can't afford the service. But I'm of the mind that there's no harm in trying, as he's responded numerous times in the past to various members on here. So if you do want to try to email him, then I'd suggest explaining how much you love his method and asking a few useful questions like that you noticed that the buy-stop part of the method from the book was dropped, in favor of buying a close above the breakout level. Has there been any other refinements/changes to the books content etc. Also you could ask if he has any links/references to other interviews he's done as we have a big gap between the Technically Speaking interview in 1997 and the first Financial Sense interview last November.
Similar threads
- Replies
- 2
- Views
- 5K
- Replies
- 170
- Views
- 31K
- Replies
- 9
- Views
- 17K
- Replies
- 0
- Views
- 2K