Stan Weinstein's Stage Analysis

Gold (GC) Stage Analysis

I've done a updated stage analysis of Gold (GC) as it's testing key levels again.

After a relatively brief Stage 4 breakdown in April, Gold held support from the larger Stage 3 range lows and broke out of a small Stage 4 consolidation and moved above the one year down trend line in August. It’s now forming a new Stage 1 range in the upper part of the larger one year Stage 3 range. But it is at a critical juncture as a move below the recent swing low and the 200 day MA at around 1660 will take it back into Stage 4A again imo, but within the larger Stage 3 range still.

Relative performance versus the S&P 500 has been improving a bit since the summer, but has been relatively flat over the course of the year. The 30 week weighted MA has been rising since August, and price has stayed mostly above it.

Weekly cumulative volume is close to giving a new sell signal and it wasn't able to make a new high during the summer move up, but it hasn't sold down yet and has been sideways for the last few months. But in order to see a break above 1800 and back into Stage 2, you'd need to see cumulative volume build to new highs and relative performance improve.

So I currently have it at a critical juncture in Stage 1, within a larger Stage 3 range. A move below 1660 is my Stage 4A breakdown point to watch for. And if it does breakdown again then the initial swing target would be 1546.9 which would take it back to retest the bottom of the larger Stage 3 range. Attached is my charts
 

Attachments

  • Gold_Stage_Analysis_12_12_12.png
    Gold_Stage_Analysis_12_12_12.png
    154.4 KB · Views: 372
Re: Gold (GC) Stage Analysis

MNST - Monster Beverage - STAGE 4 continuation shorting opportunity

Monster is in stage 4 as the 150 has been declining and huge volume selloffs

There has been a counter-trend rally back near the 150.

I went short today with stop above the 150 at the most recent pivot above the 150 (30 week) -- My buy-stop is $61.68day

Energy drink sector under fire due to deaths associated with energy drinks and pending legislation to ban or change the industry.

ISATRADER....where you suggest Stan places his protective BUY-STOP for this trade???? Just curious your feedback...Thanks.

Happy Trading.....And Remember Stan says to ALWAYS Trade with stops.
 

Attachments

  • MNST stage 4.jpg
    MNST stage 4.jpg
    217 KB · Views: 301
  • MNST - daily.jpg
    MNST - daily.jpg
    210.9 KB · Views: 316
Last edited:
The rule from the book for traders is that "Traders should never stay with a short position that moves above it's 30 week MA, even momentarily." So in the MNST case that would be a move above 59.89 - but a stop should also always be above a round number - so at 60.15 for example. However, you need to consider the prior peaks at 61.58 and 59.07; and the 200 day MA also, which is at 61.11, so your stop placement looks sensible from that perspective.

This looks to be a brave short though imo, as MNST has moved above it's 50 day MA - which you would normally place a trader stop above, and is close to it's prior peak. I can see it's hit some trendline resistance today, but it is still above its continuation breakdown level of 52 also. So my personal preference would have been to wait until it closed back below that level and the 50 day MA before going short as that would then have given you a more recent swing high to place your stop above. As although today's action looks good, it's still above it's one month trend line and short term moving averages and has outperformed the S&P 500 by almost 30% since it's October low.
 

Attachments

  • MNST_weekly_13_12_12.png
    MNST_weekly_13_12_12.png
    121.7 KB · Views: 348
Last edited:
Update on X - US Steel moving today into stage 2. Moves to multimonth high and clears the channel high of $23.78. Weekly close above that level is very bullish for the Steel stock. RS is rising outperforming the indexes.....

Happy Trading.
 

Attachments

  • X- US steel - Breakout.jpg
    X- US steel - Breakout.jpg
    258.4 KB · Views: 389
Update on X - US Steel moving today into stage 2. Moves to multimonth high and clears the channel high of $23.78. Weekly close above that level is very bullish for the Steel stock. RS is rising outperforming the indexes.....

Happy Trading.

I'd agree with that. I've attached a slightly different chart which includes the separated effective volume of the small and large players, and the cumulative of the two. The cumulative effective volume (green line) is breaking out to new highs, and you can see from the separated volume that is almost exclusively coming from large players (red line), as the small players (blue line) have been sellers all year. So a strong case for a moving into Stage 2 as there is clear accumulation from the large players.

I've highlighted the swing target as well, which is 29.97 if it can get a weekly close above 23.78 today. Below is the weekly marked up chart.

attachment.php
 

Attachments

  • X_weekly_13_12_12.png
    X_weekly_13_12_12.png
    35.3 KB · Views: 1,177
I'd agree with that. I've attached a slightly different chart which includes the separated effective volume of the small and large players, and the cumulative of the two. The cumulative effective volume (green line) is breaking out to new highs, and you can see from the separated volume that is almost exclusively coming from large players (red line), as the small players (blue line) have been sellers all year. So a strong case for a moving into Stage 2 as there is clear accumulation from the large players.

I've highlighted the swing target as well, which is 29.97 if it can get a weekly close above 23.78 today. Below is the weekly marked up chart.

attachment.php

Thanks ISA=Trader.......I like that target you have in the $30 zone....you can see resistance on the chart and it allows for a smart exit. Stage 2 runs can really get going for long term big moves, but that is a very reasonalbe place to take profits or half off......Thanks for sharing & confirming. I like this page a lot to bounce ideas and empower one another to be great traders.....
 
Guys, US Steel - I don't want to be a party pooper but are you happy with the volume on the breakout and the modest close above the channel high?

Page 104 - I look for the following: either a one week volume spike that is at least twice the average volume of the past month (preferably it is even higher), or a volume build-up over the past three to four weeks that is at least twice the average volume of the past several weeks coupled with at least some increase on the breakout week.

It's also a close call for the 30 week moving average pointing up.

Cheers

It's an area we've talked about a fair bit over the thread and if you look at the ideal volume chart on p104, you'll see the volume build is on and following the breakout. This weeks volume was roughly double the previous 3 weeks volume and considering the market went lower all day, it displayed excellent relative strength to close the week above the breakout level.

The 30 week weighted moving average has been moving higher for the past 4 weeks. Often on a Stage 2A breakout the simple 30 week MA will only be flat, and Weinstein mentions this in the book, as it takes longer to react to recent price action than a weighted MA. As long as price is above the 30 week SMA and it is no longer falling - then it's acceptable to take the 2A breakout. You also don't have to take the exact horizontal breakout level; look at the examples in the book and you'll often see a sloping trendline joining the previous highs to get the breakout point. So on X if you draw a trendline across the August and the October high, then it broke out quite strongly this week.

Rewardz is playing the current US Stage 3/4 using a long/short strategy by the looks of things and so it's a relatively good long pick from that perspective imo. It's not an A+ pick, as they are rare, but as a short to medium term trade I'd put it as a C grade pick. As the volume call is tight as you've mentioned, there's significant near term resistance up to 32, the basic materials sector is in Stage 1 or 3 and the broad market is Stage 3/4. If it moves higher next week, but the volume recedes, then the book says to get out for quick profit. But ideally the volume should at least match this weeks and hopefully grow.

Remember Weinstein says in the book to use buy-stops to get in above the breakout levels - which would get you into a lot of false moves these days. The language has changed in GTA newsletters that I've read and he now says to buy a close above the level. So although it was very tight for US Steel, it did make the weekly close above the previous swing high and so is a fledgling Stage 2A. It could of course falter immediately next week and drop back into Stage 1, but the stop loss should be below the previous recent swing low, which was at 19.56. Or below a more minor swing low and the 50 day SMA for a trader, which would put it at about 20.75 imo - roughly just over 3 x ATR(200) risk, which would be acceptable for a trade. That is how I see this stock, as a trade only, as to become a investor Stage 2 pick it would need to clear the 32 level resistance. As realistically, anything up to there is just forming a much larger Stage 1 base.
 
Last edited:
Thanks ISAtrader, I have n't had time to read through the thread so sorry if you are having to repeat yourself. You point out some finer points of the methodology as well as some refinements.

I was thinking that it is not an A+ pick but because I am new to the method I was not aware of how rare these are. I agree that does not mean that is not an acceptable trade though.

I was not aware of the change in the buying a close above the channel break as opposed to a print above. I suppose that makes sense because of the change in market conditions since the book was written. So, owing to this change in Weinstein's stance on the entry point we may see a gap up on Monday.
 
No worries about going over it again. It's good to keep it fresh in my mind and makes me check to be sure.

A+ picks are very rare, once a year maybe in the major stocks, unless you're looking across a very large stock universe, which most people don't have the time for; and volume is the most problematic area to read especially in large stocks like in the S&P 500 as they are all bought by various index funds etc. So that is why I added the cumulative volume to my own charts, to help me read when it's accumulating clearer, as volume is another area of the market that's changed a bit since the book was written. Although, if you trade in the small caps then the volume will much more like the book.
 
Last edited:
I've been meaning to ask you who your chart provider is and I'm intrigued by the indicator which filters large and small player volume!
 
I've been meaning to ask you who your chart provider is and I'm intrigued by the indicator which filters large and small player volume!

Charts are an end of day software called ProTA Gold, and the Effective Volume indicator can be found for free on Chartmill, which has a free stock screener and web charting software. Here's the link: ChartMill.Com | Screener for Stocks on Euronext, Amex, NYSE and Nasdaq Markets.

Effective Volume is quite complicated to explain, so much so that there's a whole book on it called 'Value in Time' by Pascal Willain who created it. Not an easy read, as it is a lot of maths and he doesn't have the best writing style. But you can look at his site for more info which is: Effective Volume - Home
 
I note that many (most ?) of you trade US stocks, even though you are in the UK. Is this simply because there are more stocks/opportunities in the US markets than here ? Or do you feel they work better with technical analysis ?
 
Charts are an end of day software called ProTA Gold, and the Effective Volume indicator can be found for free on Chartmill, which has a free stock screener and web charting software. Here's the link: ChartMill.Com | Screener for Stocks on Euronext, Amex, NYSE and Nasdaq Markets.

Effective Volume is quite complicated to explain, so much so that there's a whole book on it called 'Value in Time' by Pascal Willain who created it. Not an easy read, as it is a lot of maths and he doesn't have the best writing style. But you can look at his site for more info which is: Effective Volume - Home

Thanks ISAtader, think I'll give the mechanics of effective volume a miss:confused:
 
I note that many (most ?) of you trade US stocks, even though you are in the UK. Is this simply because there are more stocks/opportunities in the US markets than here ? Or do you feel they work better with technical analysis ?

The former with me but I don't see why Weinstein's method would not work with UK or any other countries stocks as long as the liquidity is there.
 
I note that many (most ?) of you trade US stocks, even though you are in the UK. Is this simply because there are more stocks/opportunities in the US markets than here ? Or do you feel they work better with technical analysis ?

I have traded both UK and US stocks with Weinsteins method, and my best trade last year was actually Rolls Royce (RR.L) a UK stock, which I bought in November on Stage 2 continuation move above a two year Stage 3 range, and then held until July when it looked to be developing a new Stage 3 range (I traded out briefly in March and got back on in April). Obviously, if I'd followed the method to the letter by moving my stop loss up then I should still be in it today. But, I didn't so it's a lesson for me to be less impulsive with my exits and stick to the method.

UK Stocks as a whole however, are more expensive to trade, through the higher fees and the wider bid/ask spreads, and are also much much less liquid than US stocks, except for the top 20 or so largest stocks. So I generally have only traded them in my ISA as longer term holdings and not as short term trades. As the higher fees eat into your returns if you short term trade them. And it can be very hard to have a hard stop loss, as they can be much more spikey on the daily charts due to the lighter volume. So are more suitable generally for the investor method which has much wider stops or a soft stop that you'll implement yourself if it hits your level.

Sharehunter has traded the UK stocks with Weinsteins method for many years as well as the US market, so he might have a different view to me, so Alan if you are reading this, (as I know he does ;)) - whats your view on it?

I think US stocks are most suitable for the method because they have much greater liquidity, tighter spreads, low commissions, and the benefit of additional internal information that is available through the various market breadth measures which are covered in the book. These can obviously be created for the UK market as well with some manual effort, but it would cover a much smaller sample of stocks, whereas the NYSE data is broad (over 3000 stocks) and readily available on many sites.

Stage Analysis can work on any product such as Stocks, Commodities, Bonds, Treasuries, Futures, ETFs etc. But it was created based on a top down approach for US stocks, from the main indexes, to sector analysis, to individual stocks and market breadth gauges like the Stage Surveys, Advance Decline Line, Momentum Index, New highs - New lows etc. So stage analysis on other products is not always as comprehensive, as you often have less information to make your stage analysis from, and so it's based around a more simplified form of the method. Which nonetheless can still be very effective.
 
Last edited:
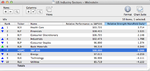
Attached are the updated major charts for your own stage analysis and the relative performance table. The updated market breadth measures can be seen in the Market Breadth thread here: http://www.trade2win.com/boards/technical-analysis/147476-market-breadth-19.html#post2035492

attachment.php


The following is my observations on the attached charts. You might or might not agree, but I find it useful to write down my analysis, and it gives me something tangible to review in the future.

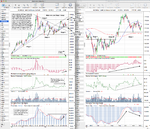
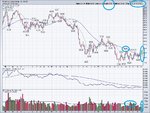
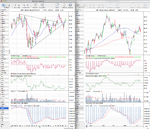
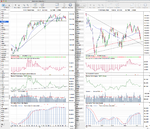
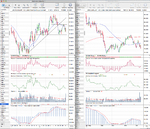
I'll start with the major stock indexes in the US. The S&P 500 had a pop and drop week, ending slightly lower on hope that the Fed would do something more to prop up the faltering market. So the S&P 500 ran up into the announcement on Wednesday and then started to sell off as Bernanke was talking and continued lower for the next two days. On the daily chart you can see that it faltered at previous resistance around the 1430 zone from the September/October swing lows, and the November swing high, to close the week below the falling 50 day MA once again. If price breaks below last weeks low in the coming week, then last Wednesdays swing high at 1438.59 will define the top of the Stage 3 range for me personally, with the low of the range already defined by the November low of 1343.35

On the weekly chart you can see that price is just 3 points above a slightly up-sloping 30 week weighted MA and within one days average true range of the one trend line that was briefly violated in November. The momentum index continues to show a large divergence with the price action, and the 30 week weighted moving average momentum is also showing the same, barely moving above it's neutral point over the last 4 weeks and still under it's own declining 10 week MA. Cumulative volume (which is not shown on the chart) is also below it's own declining MA, and if you look at weekly force index here: http://stockcharts.com/h-sc/ui?s=$SPX&p=W&b=5&g=0&id=p70181141506&a=247570490 then you can see that it is the weakest top (if it is a swing high that is) of the last three years by that measure; as it hasn't even managed to get above the zero line this time.

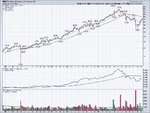
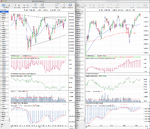
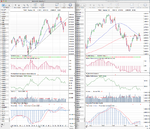
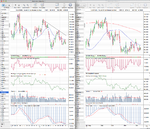
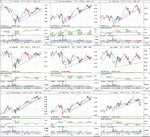
The Nasdaq 100 chart doesn't look much better either, and looks to be continuing it's Stage 4 decline after pulling back to test the 200 day MA over the last few weeks. AAPL http://stockcharts.com/h-sc/ui?s=AAPL&p=W&b=5&g=0&id=p15674424399&a=286203674 has a big weighting in this index at almost a fifth of the index, and so it's own Stage 4 continuation move last week will weigh on the Nasdaq 100 performance if some downside momentum builds.

The Russell 2000 Small Caps are showing a bit more promise than the large caps and is outperforming slightly. However, the chart has most of the same problems as the S&P 500 and is close to it's 30 week MA and it's one year trendline. So if the others break down then it will likely too, as it's highly correlated to the S&P 500 at 93% on a 200 day average.

To the market breadth measures. The short term moving average breadth charts reversed last week giving bear alert signals on the S&P 500 and Nasdaq 100, and a bull correction signal on the broader NYSE Percent of Stocks Above their 50 Day Moving Average chart http://stockcharts.com/h-sc/ui?s=$NYA50R&p=D&yr=1&mn=0&dy=0&id=p94044746428&a=281333308. The more significant medium to long term charts are still on Bear correction status and will move back to bear confirmed if they drop another 3 or 4 %. So the short term reversal from last week could cause that if it gets some more traction in the coming week.

The cumulative Advance Decline line broke out to a new high this week, but reversed to end the week lower and back in the range http://stockcharts.com/h-sc/ui?s=$NYAD&p=D&yr=1&mn=3&dy=0&id=p50761066946&a=286203909. Whereas the New Highs - New Lows dropped back into the neutral zone below the 100 level http://stockcharts.com/h-sc/ui?s=$NYHL&p=W&b=5&g=0&id=p03781770485&a=264273676, so there are warning signs developing in the internals overall for the US stock market.

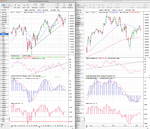
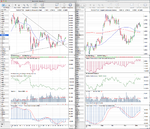
The European indexes continue to outperform, with the German DAX topping the relative performance table for another week. The DAX is currently in Stage 2B, but it's currently testing it's 2011 highs, so if the US markets do infact roll over and enter Stage 4 then it will be interesting to see if some of the money from there is reallocated to the European markets, or if they will be dragged down by the external forces. The FTSE 100 is not as strong and is only in Stage 3 currently, although it is showing good relative performance.

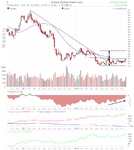
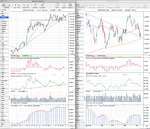
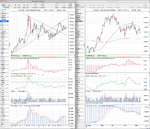
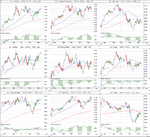
Gold (GC) - I did a stage analysis earlier in the week noting Gold was in Stage 1 within a longer term Stage 3 range. The price action since then has taken it lower towards my Stage 4A breakdown level of 1660, closing below the short term trendline and cumulative volume gave a weekly sell signal. So I'm going to revise my stage rating to Stage 1- for Gold, as it looks to be weakening.

Copper (HG) continued to rise up the relative performance table and is now in third place, but it is hitting previous resistance around the 3.7 zone, so the short term direction looks less assured. Stage wise I'd put it in Stage 1 currently with a Stage 2A breakout point above the September highs.

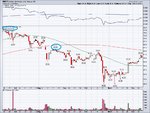
Crude Oil (CL) continues to be the weakest of the major charts in Stage 4B. There's the potential of the beginnings of a Stage 1 range developing over the last few months, but it needs to close above it's still declining 30 week weighted MA to change to Stage 1A imo.

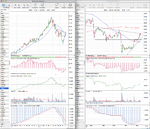
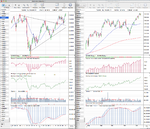
The US Treasuries are interesting charts as the 30 year has broken it's 2 year trend line convincingly now and is below it's 30 week WMA. It's Stage 3 range has been developing since May this year and the lower support zone is fairly well defined between 145 to 147. But the most recent swing low failed to get below 146 and that level is now below the 200 day MA, and so any move below there would be a Stage 4A breakdown imo. However, one positive for the treasuries is that the cumulative volume continues to hold above it's own MA, and so that is still on a buy signal, whereas the other measures such as relative performance are mostly neutral currently. So Treasuries are in Stage 3 in neutral posture.

Finally, the Dollar Index (DX) continues in it's Stage 4 downtrend within a longer term Stage 3 range. It could be argued that it's beginning to form a Stage 1 range and currently moving lower to test the September lows, but it's still well below the 30 week WMA so I have it as Stage 4B for the time being with strong support around the 79 zone.
 

Attachments

  • FTSE100_Weekly_14_12_12.png
    FTSE100_Weekly_14_12_12.png
    142.2 KB · Views: 220
  • DAX_Weekly_14_12_12.png
    DAX_Weekly_14_12_12.png
    137.6 KB · Views: 270
  • IWM_Weekly_14_12_12.png
    IWM_Weekly_14_12_12.png
    132.7 KB · Views: 268
  • NDX_Weekly_14_12_12.png
    NDX_Weekly_14_12_12.png
    140.5 KB · Views: 277
  • SPX_Weekly_14_12_12.png
    SPX_Weekly_14_12_12.png
    148.5 KB · Views: 255
  • US_30yr_Treasuries_14_12_12.png
    US_30yr_Treasuries_14_12_12.png
    134.7 KB · Views: 246
  • TY_10yr_Treasuries_14_12_12.png
    TY_10yr_Treasuries_14_12_12.png
    133 KB · Views: 196
  • CL_Weekly_14_12_12.png
    CL_Weekly_14_12_12.png
    139.1 KB · Views: 242
  • HG_Weekly_14_12_12.png
    HG_Weekly_14_12_12.png
    134.1 KB · Views: 267
  • GC_Weekly_14_12_12.png
    GC_Weekly_14_12_12.png
    129.1 KB · Views: 223
  • DX_Weekly_14_12_12.png
    DX_Weekly_14_12_12.png
    132.1 KB · Views: 257
  • Major_Charts_RS_list_14_12_12.png
    Major_Charts_RS_list_14_12_12.png
    23 KB · Views: 1,063
Last edited:
US Industry Sectors

Attached is the US Industry Sectors weekly and Daily charts and the relative performance table. The sector charts show weakness in the recent market rally with mostly Stage 3 looking charts and a few early Stage 4 charts.

attachment.php
 

Attachments

  • US_Industry_Sectors_14_12_12.png
    US_Industry_Sectors_14_12_12.png
    125.1 KB · Views: 281
  • US_Industry_Sectors_D_14_12_12.png
    US_Industry_Sectors_D_14_12_12.png
    118.7 KB · Views: 295
  • US_Industry_Sectors_list_14_12_12.png
    US_Industry_Sectors_list_14_12_12.png
    20.9 KB · Views: 1,276
Last edited:
isatrader, you're doing a great job with this thread. Well done!

I have a copy of the chapter from the book Technically Speaking where Weinstein is interviewed on his system. I'm not sure if I can post attachments to this forum, but if you'd like, I can try having the pages scanned and sent to you. I think the book was written in the mid 90s.

Hi gdiddy, a belated welcome to you and thank you for your kind words. I appreciate it.

That sounds interesting about the book. If it's only a small sample, then I think we might get away with posting Weinstein's section of it on here as it's fairly obscure and long out of print. As, if anyone has a problem with it being posted then t2w can remove it. So if you scan it then and then save it as a pdf, then you can post it as an attachment. Or if it's just images save as .png or as a .gif if you can to keep the file sizes of the pages down.
 
Top