Sniper Forex System

anybody use MA to know direction of the trend?

I use SMA (3 offset by 3 or 3 periods based on the average price (H+L / 2)) in 3
ways :

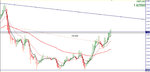
1) The angle of the 3 simple, moving average (offset by 3 periods) shows the direction of the
trend. If pointing down the trend is down - if pointing up it is in a uptrend

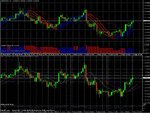
2)The position of the price below or above the moving average shows if the price is in a buy (above) or sell (below) phase. when the price is not touching the moving average it can be assumed to be in a trend (see the chart below)

3) It also show periods when the price is in a sideways market - when the candles are
touching the Moving average it is a warning of a possible sideways market or a crossover
into another trending phase.


Some traders use the above as a trading method on its own. Enter on a close when the candle is
not touching the MA and exit when it does again. Don't trade when the price is touching the MA.

Very effective if traded using multiple timeframes . Very simple

very interesting. thx for sharing. can you upload the chart? and how do u use this for multiple timeframes? you mean trend needs to be showing in all timeframes?
i'm mostly interested to see if this can help me stay out when the markets are going sideways.
 
very interesting. thx for sharing. can you upload the chart? and how do u use this for multiple timeframes? you mean trend needs to be showing in all timeframes?
i'm mostly interested to see if this can help me stay out when the markets are going sideways.

yep for example angle of SMA on the 1hr chart should be in the same direction of the 4 hr chart. If you plot SMA( period=3,shift=3,simple,(H+L / 2)) on your GBPUS chart, you can see SMA pointing up on 4h,1h,30min, 15 min charts and the candles are not touching the SMA so we can assume cable is trending up.
movingave-600x283.png
 
New2FX, are you talking about something like the Alligator? I think that most MT4 platforms should have it as a standard indicator.
Image below, not too clear I,m afraid. Probably better to load it into your own graph.
As with all MAs, it's a lagging indicator and the sniper bands do seem to react more quickly.

BTW, when viewing an image, it's usually better to right click the image and open in a new tab or window
 

Attachments

  • 2graph.JPG
    2graph.JPG
    128.1 KB · Views: 149
Last edited:
If you drop a 5m 20 EMA and a 15m 20 EMA onto a chart and observe the cross, that is basically the entry point Sniper is giving you.

Then add a 60m 20 EMA and a 4hr 20 EMA onto your chart which will determine your medium term trend and away you go.

When Im looking at Sniper I mainly observe what the Sniper trend B indicator is telling me.

Ive enclosed a screenshot of my "template" which I am using along side Sniper.

Dave
 

Attachments

  • MTFMA.jpg
    MTFMA.jpg
    154.6 KB · Views: 642
New2FX, are you talking about something like the Alligator? I think that most MT4 platforms should have it as a standard indicator.
Image below, not too clear I,m afraid. Probably better to load it into your own graph.
As with all MAs, it's a lagging indicator and the sniper bands do seem to react more quickly.

BTW, when viewing an image, it's usually better to right click the image and open in a new tab or window

Hi gumrai
No,I am not talking about alligator, don't even know how to use it. What I am referring to is Simple MA. You are right MA are lagging indicators that why I use them on longer timeframes 1Hr and up. If you plot it on your GBPyen chart, you will see that on the 1hr chart, from 28.08.2009 @ 1600gmt till 31.08.2009 @ 5gmt candles were going down in the same direction of SMA and they were not touching it so we were in a strong downtrend
 
If you drop a 5m 20 EMA and a 15m 20 EMA onto a chart and observe the cross, that is basically the entry point Sniper is giving you.

Then add a 60m 20 EMA and a 4hr 20 EMA onto your chart which will determine your medium term trend and away you go.

When Im looking at Sniper I mainly observe what the Sniper trend B indicator is telling me.

Ive enclosed a screenshot of my "template" which I am using along side Sniper.

Dave
Hi dave!
Thanks for the method. How do you put MA from 2 different Timeframes on the same chart?
 
Hi dave!
Thanks for the method. How do you put MA from 2 different Timeframes on the same chart?

Use M15 chart and put:
5EMA for M5 20 EMA
20EMA for M15 20 EMA (of course)
80EMA for H1 20EMA and
320EMA for H4 20EMA.

Dave, would be great to get some more info on your system/usage of the template.

Kr, Jerry
 
I don't know if ya'll realize it, but in the last week we have generated enough interest in this thread, that we have had almost 10,000 views by other members and guests in this forum, since last week.
Kent
 
kent - do you enter trades during the asian sessions?

for cable, i always wait for 7am+ , but i know you trade gbpjpy.

I generally wait until 00:00gmt to go in on a trade. The Asian session generally gets things going on yen pairs. I told Gary a while back I was looking for a pair to trade in the Asian sessions and he actually told me to look at gbpjpy. But yes, and since there is a high correlation to gbpusd and eurusd, I dont think I would hesitate to enter during the asian.
Kent
 
Sniper has already signaled an entry on the 00:00gmt candle, and I am just waiting for a confirmation on all indicators, one is still blue, and I will enter. the 30M is already all red and I have entered on demo. I am waiting on the 1H to go in on live.
 
Looking at the weekly chart, gbpjpy has just started wave 5 down, so we should have ample short trades in the coming months. This pair actually started the 5 wave cycle at wave 1 in july 2007, so this has been on going for a while.
 
Dodgy times Kent.
The GBP/JPY seems to be right in the centre of a range right now. A fair size range admittedly - between 149.00 and 150.50.
I feel that it is 50/50 which way it will go. The main recent trend is down, but I wouldn't like to rely on that too much.

BTW if you and 2be use Elliot wave in your decisions, I'd really like to see more posts of charts as the action unfolds and a short explanation of why you make those decisions. If you have the time, of course. :)


If this comes out it is the basic idea of what is going on in the big picture, so really the ranging is nothing more than a minor correction in the overall downward trend. This is my interpretation of the chart, 2be may be able to provide more info, or correct any discrepancies.
I feel like wave 3 extended, so usually wave 5 will truncate when that happens. So we may have somewhere around 1000 pips to go or so before the 5-3 wave is complete. But I could be off. Sometimes the only way to know for sure is when it is over.
Kent
 

Attachments

  • gbpjpy 082609 .gif
    gbpjpy 082609 .gif
    25.3 KB · Views: 160
Looks like the trades are few and far between lately. Oh well, will be another day.
Goodnight all
Kent
 
Looks like the trades are few and far between lately. Oh well, will be another day.
Goodnight all
Kent

Luckily you waited for the H1 charts. M30 would've given what looks like a false signal up to now. I've decided to stick with H1 for the time being.

What I find though is the market doesn't really hot up and decide on a direction, until the end of the asian session and start of the european session...so your short might be confirmed a little later on H1.
 
Top