SLAyers' Notes

Status
Not open for further replies.
I tend to keep most of my time frames on separate charts as switching from one TF to another re-plots my lines, I then become distracted and start redrawing everything and not watching price.

Perhaps you need to simplify. This is the layout I use. Once I'm done with the daily/hourly, I click the 1m to bring it forward. And that's that. Each chart needn't fill the screen.

Db
 

Attachments

  • Layout.gif
    Layout.gif
    133.9 KB · Views: 182
I eyeballed the apex and given that the hinge was far from symmetrical I thought I would have to readjust the longer price stayed in the hinge.

The hinge needn't be symmetrical. This is an issue that those who can't distinguish between patterns and behavior seem unable to grasp. The hinge is what it is because traders through their transactions are reaching an approximation of value, and they aren't doing so by consulting a chart. In this respect the hinge performs the same function as a rectangle, or range. The difference is that the hinge works its way toward a resolution, whereas a range can go on and on and on with no foreseeable end. It would be unreasonable to expect the negotiations which result in the hinge to result in some sort of perfect geometric shape. What is much more important is the process.

You may want to review Appendix A as well as "Equilibrium".

Db
 
Price seems to have moved up away from the weekly mean and daily LL, prior to open we are sitting near the MP of the hourly and the 10 minute is in a range/hinge.
 

Attachments

  • nq26042016daily.png
    nq26042016daily.png
    44 KB · Views: 155
  • nq26042016hourly.png
    nq26042016hourly.png
    30.6 KB · Views: 143
  • nq2604201610min.png
    nq2604201610min.png
    33.7 KB · Views: 139
I have to say that I'm still chewing a bit on this weekly channel...

The way DB and you have drawn it are hard for me to grasp.

It's clear that the channel itself should provide information on overbought/oversold conditions and potential opportunities...

But wouldn't it make more sense like that?

nq_weekly_channel.jpg


Ceterum censeo Carthaginem esse delendam :LOL:
 
I have to say that I'm still chewing a bit on this weekly channel...

The way DB and you have drawn it are hard for me to grasp.

It's clear that the channel itself should provide information on overbought/oversold conditions and potential opportunities...

But wouldn't it make more sense like that?

In order to obtain a correct channel, one must begin at the beginning. See post 665. One can come up with all sorts of alternative starting points and channels, but the end result is couldawouldashoulda. Would your channel have prompted you to short 4584 last week?

Note that your channel provides 10 overbought conditions. The channel I drew acc to Wyckoff provides 1.

Db
 
The connection to Wyckoff is simply the start at the beginning?

Rereading section 15 I did not find anything where he is talking about keeping those older or formally drawn channels or that those can hold price.

But as the channel is just another form of range, revistiting those old ranges seems to make sense.

Thanks for your clarification...

If one doesn't start at the beginning, where is he to start?

If one doesn't understand trend, he will ultimately fail, often after years of struggle. If one understands trend, even the trend line itself becomes superfluous. Searching for precise starting points amounts to the same fruitless search as for the perfect MACD setting.

The trolls at ET and BMT used to go on -- and probably still do -- about my, to them, incorrect use of trendlines. But how many of them noticed that AAPL broke its stride last Monday? That the NQ reversed from an overbought condition the next day? That what had been the two leading sectors broke their strides the day after that? How many of them are looking at yesterday and asking "who knew?"

There is a mine of information in the Burrow about trend and sectors and groups and indicator stocks. Given that index futures move as they do because of the underlying, it should be understood without saying that one must follow the underlying. If one doesn't for whatever reason, he will forever be asking if that was a good entry or mire himself in regret over the trade he should have taken.

As you say, and as I point out in the book, a trend channel is another form of range, a diagonal one. But this is not a matter of revisiting old ranges; it's a matter of understanding that the range we're in is the same one that began four years ago.

Db
 
The weekly provides context and direction, the LOLR. If one does not give it its due, he will spend a lot of time looking at the trades he should have taken but didn't.

You know that if the only tool you have is a hammer, every problem looks like a nail. If you focus on ranges, then every op for which you look will be sought in the context of a range, and the range is nothing more than a state of equilibrium. Waiting until price reaches the UL or LL of the range, much less breaks out of it, is time and opportunity wasted.

In terms of this post I have to ask: In general, the core of the concept is trading at the extremes - which would be upper and lower limit of a range or channel, taking reversals or breakout trades.

But you mean that if the LOLR is clear one could take every opportunity in that direction like an SLA trade within a range - or trading away from the midpoint (equilibrium).

Do I get this right?

The "core of the concept" is tracking the imbalances between supply and demand. That particular post had a context. As for how one plays ranges, and trends within ranges, and reversals within ranges, and trends after breakouts from ranges, there are tons of examples in the book. As for trading into and away from midpoints, it's up to the trader to test whatever hypotheses he might have using whatever instrument he trades using whatever bar interval he prefers. He can then develop his own protocols for entry and management and exit, all of which may and probably will change if he changes bar intervals or instruments.

The trader who wants to get the most out of this will ask himself how much time he spent practicing on replay last night and when was the last time he read Appendix D. This is in addition to preparing for the upcoming session, keeping real-time notes of the session, reviewing the session, and preparing for the next session. This applies to everyone, even those who are trading daily charts.

Db
 
Addendum:

In the interests of saving a lot of time, I'll ask this: did those who trade the NQ using a 1m interval short the RET this morning at 0941? If not, did they short the next RET at 0944? If not, why not? Nothing else is pertinent. Everything else is theory and philosophy. If one has no answers, principles are not going to help. The only thing that will help is replaying the morning using whatever software one has for replay and figuring out why he missed these trades. Same thing goes for yesterday's RET at 1005.

Db
 
Late.

Prep should have been posted prior to open but I did not have time (snip, edit, save, post) so what follows might seem a little hindsight-ish.

Overnight had seen a drop off which put price through the weekly mean towards the LL of its channel and had also broken through the lower extreme of the daily channel, LOLR down.

Starting with the hourly chart, (which is the first image) Since the close the previous day price had made a 40 point drop putting us clear of the LL of the hourly. The first area lower that sticks out are the swing lows that are marked on the chart, there is a chance we ret back to 4440 and retest before dropping further, but as far as the downside goes 4375-4365 seem reasonable.

Going into the open there was a low at 4401 and a most recent high at around 4407 with the ONH at 4417 +/-. Was not going to do much about the spike lower 3 minutes prior to open other than watch what happens next.

Actions and notes in the next post.
 

Attachments

  • nq2704201660min.png
    nq2704201660min.png
    33.5 KB · Views: 149
  • nq270420162min.png
    nq270420162min.png
    38.9 KB · Views: 152
Chasing bunnies.

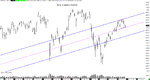
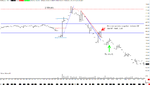
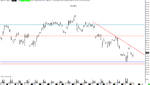
Quick start to the open with the first decision within the first minute. Prior to open price had broken lower, the open however saw price break higher, this BO up was equidistant (roughly) to the BO lower, I did not take the ret long as this seemed rangy, I opted to take a long if price broke higher.

Had to wait 2 minutes before price broke higher, however, I hesitated on the first ret as the ONH was close by, but, if price was going to ret back to 4440 this could be the place to get long. Also worth pointing out I was aware I was swimming against the current from the weekly and dailies and planned to flip on any weakness.

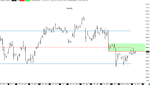
Long was 40 seconds late and about 6 ticks off from ideal, within a minute price broke stride, tracked for a lower high and aimed to flip to short should the short trigger (Location = ONH - Behaviour = Stride break & LH) the marker is off a couple of bars. Hadn't edited the quantity so instead of flipping I was flat (did not notice immediately) and had to look for another LH which came a couple minutes later.

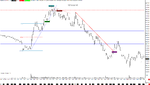
Short experienced a little recoil but the DP was high and dry, price eventually started heading lower, there was a little recoil at 4400 but the SL held and PA takes us to new lows.

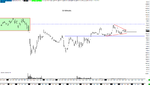
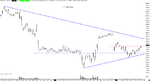
Price starts recoiling which is not a big deal, it breaks stride which is still nothing to be concerned with as I expected it to do so with it passing the ONL, now I make some mistakes which has a lot to do with the TF I'm using.

Everything had been done on a 10 second chart, when price dropped off I switched to 30s, there was a break of stride which was more than 3 points but the ONL/PM range LL + break rule was my line in the sand, but, I then switched lower back to 10s and saw a potential HL form and tracked for a possible long (2 trades per day ATM) so I would have flatted out.

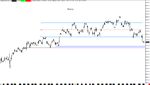
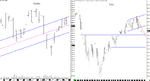
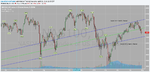
Whilst I think the exit is sound given the TF I was looking at (SL break + HL), I had lost contact with context and micromanaged my way out of a sound trade. Once price is under way I tend to switch up to a 1m or 5m to manage, the 1 minute paints a different picture and the range break test was intact.

To put it simply, I expected trouble (ONL and the round number at 4400) and I dropped to a time frame where I would find it.
 

Attachments

  • nq270420161min.png
    nq270420161min.png
    52.6 KB · Views: 163
  • nq2704201610s.png
    nq2704201610s.png
    39.1 KB · Views: 186
With what are you dissatisfied?

What do you plan to do about it?

Db

1st trade I am ok with, it was a dicey area and staying on a low TF alerted me to the change in balance quickly allowing me to do something about it.

Whilst what happens after the exit on 2 is unknowable at the time, I expected a little recoil in the area. With the trade under way I shoulda stayed out on the 1m+ and managed until price got to an area where PA was likely to change then cut down on the TF.

Other than being a round number and ONL (nearby) there was nothing obvious that stuck out at 4400.

Dissatisfied with being sucked into the LTF by a simple expected recoil (how it looks to me on the 1 minute in hindsight).

Once price is under way move out to HTF and manage as per rules, switching to LTF once price gets to an area where change is highly likely, example 4375 today.
 
A few things for now.

Don't allow your judgement to be clouded by your feelings. "Seemed rangy". "I opted to take a long if price broke higher . . . however, I hesitated on the first ret as the ONH was close by, but, if price was going to ret back to 4440 this could be the place to get long." A lot of qualifications there, which one can't afford even when trading a daily interval. There's no time for that. Either price is ranging according to your criteria or it isn't. If it is, trade it according to whatever protocols you've developed for trading ranges. Otherwise, just take it. As for ONHs and ONLs and PDHs and PDLs and so forth, be aware of them in case price hesitates and the hesitation won't be unexpected. More often than not, however, price will simply breeze through these levels as though they weren't there. Do NOT decline a trade simply because it's at or near one of these levels or a round number or whatever else you've determined is or might be "support" or "resistance". Take it as long as the trade falls within your risk tolerance.

As for the LTF and HTF, do try to think of these as bar intervals, not time frames. Viewing price action in terms of "time frames" is like wearing blinders and defeats an understanding of the continuity of price. There is no "frame". There is no beginning and no end. Trading as though there are just adds an unnecessary level of complexity, and the less complexity the better.

Remember also that the bars are nothing more than a means of illustrating waves. If you're watching price as you trade, you can see these waves. If you can't, then choose a small interval -- the smaller the better -- and zoom out until you see a line and not the individual trades. Whether or not you use this to trade is not as important as knowing and understanding what's going on "behind" the chart to generate all these bars. Once this becomes part of your background, you'll be better able to judge traders' conviction and hesitation, which can be particularly useful in avoiding chop.

Db
 
prep

A small PB back towards the mean of the weekly, daily is pushing lower under a SL and the hourly is between 4440 and 3675. 10 minute is possibly in a hinge.
 

Attachments

  • nq28042016weekly.png
    nq28042016weekly.png
    76.1 KB · Views: 168
  • nq2804201660min.png
    nq2804201660min.png
    34.4 KB · Views: 181
  • nq2804201610min.png
    nq2804201610min.png
    33.6 KB · Views: 149
Last edited:
I saw it more as a continuation of yesterday's overnight range, but they're both equilibrium states.

This demonstrates how two people can look at the same thing, view it differently, yet come to the same conclusion, which is a chief reason why I avoid being too directive (which I'm sure will make some people laugh, but I could be a lot more directive than I am; the discoveries one makes oneself stick a lot better).

Db
 
How do you apply the W and D lines to 1 minute or seconds charts to enter a trade?

Do the trend lines that are drawn on the D and W charts correlate with the lower time frame charts to enter an intraday trade?

I'm trying to figure out how to piece it all together? Do you utilize the SLA on the D, W and Hourly charts to find key levels? How is it applied to the 1 minute and seconds charts?

What is the process of piecing it all together? Any help would be greatly appreciated. Also, does anyone apply SLA to YM?

Thank you
 
Last edited:
Status
Not open for further replies.
Top