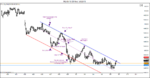
Weekly shows a possible bounce off the lower channel limit. Does this make the LOLR up or down? Does it impact taking the long on a break of the daily SL?
If you don't define "bounce", then you won't know what to do with what appears to be a bounce. If this meets your criteria for a bounce, then the LOLR is of course up. Whether you buy the reversal or wait for a break of the SL and buy the retracement is up to you.
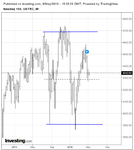
Daily: there was break of the SL on Friday afternoon. This means the trader looks for a long entry.
If the nature of the break was such that it prompted him to exit his short, then, yes, he would look for a long entry. That entry would depend on whether he prefers trading reversals or retracements. If the former, he must decide whether or not he's willing to risk the number of points between his entry and the danger point, in this case about 65pts. Unless and until these decisions are made, the hourly is irrelevant as there will be no context for the decision. The 15m has no bearing on these decisions as it isn't being traded.
If the extent of the break was insufficient to exit the short, then he'd still be short.