SLA Interday Trading Plan

gotu

Active member
Messages
100
Likes
8
Hello, after some years of unsuccesful trading, I came across DBphoenix´s SLA approach and as soon as I got my hands on to it just made sense to me. I have spent the last 6 months studying the material and I am now initiating the data collection, the following is the roadmap I intend to follow, also based on DBphoenixs blueprint.

1- Deciding what Kind of trader I want to be and what I want to accomplish.

This is the easiest for me, I have no interest in intraday, it isn´t in harmony with my personality traits or my goals, so I will be trading the Daily and the 60 Min chart, holding trades overnight.

My goal is to eventually be able to make a good living, maintaining stress levels in line and freeing time to enjoy a good life.

2- Choosing a Market

This is tricky for me, Im not sure whether I should pick just the one market, or trade multiple markets, I guess ultimately it will depend on how frequently my setup shows up on a particular instrument. My goal would be to define a setup which is market independent, one which is an expression of human behavior and that can be frequently found on any market/instrument.

I am in Colombia, but the time difference with the rest of the globe should be meaningless since orders and stops will be placed and monitored on a daily basis.

3- Defining the setup

Here the definition is taken from DBPhoenixs PDF as well and the rest of his work, it must be precisely defined so that I can spot it flawlessly under any condition, I really don’t want to leave any space for interpretation. So far, I am working on the following premises;

For a buy orders

attachment.php


For this baseline entry the following Stop Loss and Take profit parameters are used;

Stop Loss; Below the danger point, that is below the daily Higher Low
Confirmation; New High
Exit; Break of Demand Line

First I want to collect 100 trades, in order to gather statistics on the behavior of the above setup. Additionally, from the collection and analysis of the 100 trades the setup might need to be defined in further detail.

Once this task is completed, and the statistics are clearly favorable I would go into other factors regarding the trade; Criteria for re-entry, criteria for early exit, trade management, profit targets, etc..


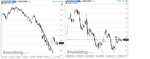
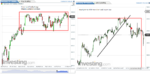
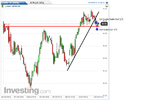
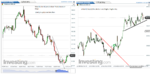
I will share some of the charts that I am collecting to illustrate what I am looking for,any helpfull commentary regarding these charts will be welcomed from anybody who feels they have something of value to add to the discussion.
 

Attachments

  • plan1.png
    plan1.png
    15.5 KB · Views: 4,353
Greetings. I was wondering what happened to you. Clearly you have been busy.

That so many of your experiences in the market have been negative is not a plus, but they're not necessarily a minus, either, if you look at them as "learning experiences". This is particularly important at your age. Reality can be a jolt that puts people back on the right path or that throws them off the track entirely.

If you haven't already, I suggest you at least skim what is suggested in "Wyckoff Lite" at TL, particularly Section 7. This will be especially relevant to you as you're trading daily charts ("tape reading" won't be required, or even necessary, though understanding continuity of price is just as important). This amounts to 45-135pp, depending on how deeply you want to get into it. I will say, however, that those who have been successful with this have studied the W material thoroughly. I suspect that's why they have no fear.

Db
 
I have been overwhelmed with work lately, which has hindered the data collection process. Additionally, I am spending considerable time with data feed providers trying to get the right historical data to cover different periods.

Nevertheless the journey continues and once I havea meaningful sample (50 trades) I will be sharing some preliminary results, before gathering the remaning 50 samples. As the data is being collected, new questions arise and as I anticipated, further definition and refining of parameters is required.

In the meantime here is a pertinent chart;

attachment.php
 

Attachments

  • ypf.png
    ypf.png
    55.9 KB · Views: 380
Given that you're actually collecting data, I should probably just button my lip and sit on my hands so that I don't discourage you. However, there is also the danger that you'll be discouraged by treading the wrong path. So take the following, or not, for what it's worth, if anything.

I was going to point out after your first post that your template needs tweaking but referred you to the Wyckoff material instead. But something must have been missed. However, this chart highlights the problem, which is that you're shifting to the hourly too soon.

You reached a climax low with this, staged a technical rally, and are now in the process of the secondary reaction. However, if you don't allow that to play out on the daily, you can easily wind up trying to catch a falling knife. In this particular example, you will see if you read the chart from left to right that there is no break of the daily supply line (if you find it necessary to draw one). So if you follow W, with or without the use of the SLA, there is nothing to do here until that secondary reaction has been completed, which is where a supply line can come in handy. At this point, this little sucker would have to break up to 11.60 to show even a half-assed effort to break this stride. In this case, however, even that is problematic as you're sitting at the apex of a hinge which began several days ago and 11.6 happens to be the upper limit of it.

I understand the desire to enter at exactly what one believes the best entry to be, even if that means entering a little early. But the desire not to "miss out" on the anticipated move can feed reckless impulses.

I suggest, therefore, that you postpone the shift to the hourly until this secondary reaction is complete and the daily supply line is broken (again, if you need to draw it), THEN switch to the hourly and enter on the retracement, if there is one. If there is, then the mice who rushed to be first to the cheese will have cleared the path for you. If there isn't, then you can sit back and feel smug.

Db
 
Thanks for this insight DB, these kind´ve observations are exactly what I need to define the setup with no ambiguity, which is my ultimate goal.


I will keep this in mind as I continue with the data collection, and re-reading the W material.
 
Keep in mind also that setups without context can bite you in the butt. This stock has lost two-thirds of its value, and volume -- assuming that what I have is correct -- dropped dramatically in 2013 and practically disappeared this year.

All this fine-sounding Wyckoff and SLA stuff is worthless if no one wants whatever it is you're thinking of buying. If Stock X has a great dividend, then at least you'll be paid for waiting. Otherwise there's something called "time risk" or "opportunity risk", which means essentially that not only is your money not working for you if it's just sitting there clipping its toenails but you are missing out on other opportunities that you could take advantage of if your money weren't in something that's going nowhere.

Db
 
Hi DB

In the spirit of reducing ambiguity.

I believe your previous guideline would be correctly applied in the following scenario but I am not sure whether this would qualify as a real break of the daily supply line.

As far as my understanding goes, a Daily SL is an Hourly Trendline. In this case, the hourly Trendline is broken, then there is a RET and a HH.

attachment.php


Is this in line with your prescription?
 

Attachments

  • FCC 30-10.png
    FCC 30-10.png
    63.4 KB · Views: 5,062
Hi DB

In the spirit of reducing ambiguity.

I believe your previous guideline would be correctly applied in the following scenario but I am not sure whether this would qualify as a real break of the daily supply line.

As far as my understanding goes, a Daily SL is an Hourly Trendline. In this case, the hourly Trendline is broken, then there is a RET and a HH.

Is this in line with your prescription?

All of what you have is drawn in hindsight, therefore what appears to be an hourly "trendline" is actually the last of several. The daily stride is broken by your last green candle and there's no need to use an hourly unless and until this change occurs. This provides you with your "trading opportunity" (see yesterday's post in the SLAyers' Journal).

Db
 
Hi DB, you didn´t adress my assertion that a daily Supply Line is an Hourly Trendline, I take it that you agree with it.

My reason for insiting on moving down to the 60 Min on the secondary reaction is so I can define the setup more precisely, and reognize it flawlesly both during testing and later on trading.

So the definition of the secondary reaction would go as follows;

3- Move to the Hourly, wait for Lower High and a Lower Low and track the downards progress with a Trendline.

4- Keep fanning the trendline until it is broken, or price makes a Daily Low (In Which case the setup is negated)

5- Once the Hourly trendline is broken, wait for an hourly retracement and enter buiy stop order above the most recent high, entering on the hourly upwave that results in a Higher High.

attachment.php


Now to collect 100 of these...
 

Attachments

  • Repsol 60m.png
    Repsol 60m.png
    70.9 KB · Views: 2,834
Hi DB, you didn´t adress my assertion that a daily Supply Line is an Hourly Trendline, I take it that you agree with it.

Actually I did address your assertion, and, no, I don't agree with it. A daily SL and an Hourly SL will be the same only in hindsight. Work your way through your charts reading left to right.

Db
 
Actually I did address your assertion, and, no, I don't agree with it. A daily SL and an Hourly SL will be the same only in hindsight. Work your way through your charts reading left to right.

Db

Actually I said that a Daily SL equals an Hourly Trendline.

In any case, I believe I understand your point about waiting for demand to assert itself with conviction in order to avoid jumping into a tarde prematurely.

I will be incorporating the break of the daily supply line and then waiting for the retracement on the hourly as part of the testing criterion.

Regards,

Gotu
 
Hi DB

In the spirit of reducing ambiguity.

I believe your previous guideline would be correctly applied in the following scenario but I am not sure whether this would qualify as a real break of the daily supply line.

As far as my understanding goes, a Daily SL is an Hourly Trendline. In this case, the hourly Trendline is broken, then there is a RET and a HH.

attachment.php


Is this in line with your prescription?

If you are serious about trading, then I suggest you look at some decent US stocks that you can apply some consistent analysis to.

It might be best to forget about where you are from and concentrate on liquidity and volatility, as there is absolutely no valid reason for not picking the best market to trade in this day and age.

Will be glad to comment on some charts if you decide to go for such a market.

Lúidín
 
Hello Luidin, thanks for your response I will be happy to hear your comments on those assets that you deem worthy of trading.
 
Hello Everyone, I am currently looking at the gold market as setting up for a particular SLA trade.

The weekly chart shows price is in an uptrend and currently sitting at the green trendline.

On the daily buyers are supporting price around 1310, the last two daily bars show a narrowing of price into a range.

I will enter the trade if price breaks above the Previous days high with a stop loss below the black line.

attachment.php


Best wishes
 

Attachments

  • GOLD.png
    GOLD.png
    41.1 KB · Views: 1,942
A very similar setup in the crude oil market;

attachment.php
 

Attachments

  • Crude.png
    Crude.png
    51.2 KB · Views: 1,892
So far the Crude trade is working well, last week Goldman Sachs lowered their price target to around 43 which in my limited experience is an indication that they are carrying a large long position and they are testing the market for selling. Price has gone up with strength since goldmans prediction which shows the buying is strong.

I will be monitoring how price reacts to the next resistance areas using Demand lines ans trend lines.

Gold is still stuck in its range and there is not much to do until price decides to break the upper or lower limit, in the former case I will let the trade run since we are in an uptrend. In the latter case I would stop the trade out anticipating lower prices for a buy opportunity but I would not go short since this would mean trading contrary to the major trend.

attachment.php
 

Attachments

  • trades.png
    trades.png
    57.3 KB · Views: 1,639
The gold trade was closed when price hit the stop loss.

I took 33% of the crude trade when price broke the demand line, the remaining two thirds will be scaled out if price shows weakness, (lower highs and lower lows)
 
Crude oil is forming a range around a significant previous high, to me this suggests consolidation. If price breaks the range below 48, 9 I will exit second lot.

Yesterday I went long platinum due to break of SL and failure to move lower.

Today I went short dax due to rejection of top of the Daily range.

I cannot post charts atm but will do once I get access to a pc.
 
Dax trade after the rejection of the daily range upper limit, it is an aggressive entry and rather than my standard setup since both the weekly uptrend and the down trend have been broken.

attachment.php


Scale outs of the crude trade, price broke the aforementioned range to the down side, my trailing stop for the second 3d was hit and then returned to the range, i have the last lot running.

attachment.php


Platinum entry showing the standard entry break of supply line and no follow thru, weekly down trend broken.

attachment.php
 

Attachments

  • dax.png
    dax.png
    96.2 KB · Views: 1,635
  • Crude 28 Oct.png
    Crude 28 Oct.png
    41.1 KB · Views: 1,649
  • Platnium.png
    Platnium.png
    97.8 KB · Views: 1,640
Closed dax trade as price broke hourly SL finding support at the Daily trendline . Will re enter if price shows another failure to break range upper limit.
 
Top