bbmac
Veteren member
- Messages
- 3,584
- Likes
- 789
2:1 H/L Breakout
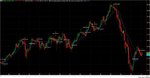
The screenshot below shows the very simple system, and the template and indicators are attached.
1. Trade on any liquid instrument.
2. Choose a trigger time frame (1hr shown) - draw horizontal lines at the last obvious price swing Hi and Lo.
3. Await a candle close above/below the last swing Hi/Lo per step 1.
4. Sell/Buy that candle close so long as:
a. A trend exists on the next 2 time frames up...as determined by the 1hr trigger indicator (dots) that shows the 12/26/9 macd signal line's relationship to it's ma line.
These dots in decsending order must be;
Downtrend; red, red, green, red or red,red,red,red
Uptrend; green, green, red, green, or green, green, green, green
(ie showing that the next time frame's (4hr) macd signal line is crossed and pointing in direction of intended trend, and the next higher time frame above that (Daily's) is at least pointing in direction of intended trade, if not crossed below it's ma line too.
b. The market entry falls within the 20day average pip range.
Risk = max 2% of account, Risk:reward ratio 1:2, ie set an oco order -Stop above the opposite horizontal line, limit order twice the stop.
Trade across multi instruments (5 forex pairings for eg)
* A countdown indicator shows the time remaining until current candle close.
* Attached here too are sound alerts for cable, euro,swissy and yen that can be set at the horizontal lines.
33.33% strike rate (winning trades as a % of total) breaks even.
I intend to demo this system in January of the new year across 5 pairings and will report the results on this thread...feel free to play along.
Platform/charting = MT4.
Attachments
Last edited: