Simple Moving Average

dazzam

Active member
Messages
106
Likes
0
Just started looking at strategies in TA and had a couple of questions that I hope you could answer, I may be asking daft questions though.

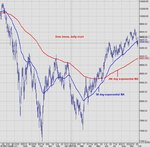
If I set an SMA of say 30 and 60 what time period do I set the underlying chart for eg say looking at HBOS do I set the time period for 1 year or longer or shorter. Or does this depend entirely on whether you are looking at short term or long term.

Then when looking at the chart to get in is it sensible to see if the price line drops or goes above the longer of the SMA's.

Is it sensible to also review trend lines and resistance levels to make sure the assesment is accurate.

Also what is crossover is this when 2 lines of an SMA cross, one going up and one going down.

Finally does anybody know where you can get free charts for intrada DAY FTSE, DOW and CAC I just have a theory I want to review to see if I am correct with my thoughts.

Thanks in advance and apologise for all the questions.
 
Go to the book section on this site and buy Murphy's book on TA.
And use the search facility on this board and type in "moving average" etc.

You will be surprised how much info. is here which will equip you to ask more searching questions.

If you get stuck then come straight back to the forums.

Good luck.
 
Have you tried the finance pages of yahoo (both UK and US) for the charts? I believe they are real time (I'm sure someone will say if thats not still the case :eek:) but you will need to refresh the page to get the latest chart. Bigcharts.com has no delay on their chart of the Dow but again you will need to re-draw the chart as it doesn't do it automatically for you.

HTH

PS Welcome!
 
If you put a 30 period on a 1min chart it's 30 mins. on 1hour chart it's 30 hours etc etc. If your 30 crosses up thru the 60 it would be a buy and vice versa. Also you can get a signal if the price crosses the average. You must experiment and see what you like. I like 21 and 55, Fib numbers.

Good luck
 
The traditional commodity brokers' moving averages are 4, 9, 18. So you buy, going long, when the 4 is above the 9 AND the 18, and then close your position when the 4 crosses down over the 9.

I've not used moving averages for yonks, but if they're your preference at this stage, then you just need to play and see what takes your fancy.

If you're really into moving averages there's a book by Scot Lowry called The Magic of Moving Averages, which is a lot of pages to describe the patterns formed by the 4, 18 and 40 moving averages.

Oh, and welcome to T2W by the way. :D
 
Read anything here by Chartman.

So many roads what ho :)
 
Hi Dazzam and everyone,
I've been looking @ using MA's for the
last month or so and one interesting MA i've cottoned onto is
the 3mth / 5 day Exponential MA. By backchecking ive seen
that if the Dow, and it's only the Dow i've checked, closes
above the 5d EMA, then this is a positive indication that the
DJ is on the up. E.g the DJ closed firmly above the 5d EMA on
Tuesday, on Wednesday the day's low of 9427 occured @ approx
9.50am and by the close @ 4.00pm the 5d EMA stood at 9426.
The DJ moving down during the day and finding support @ the
5d EMA is a v.good buy signal - and today proved this to be so,
maybe time and sod's law will show me wrong !!!
Reddragon.
 
Thnaks everyoe for your help, and it is good to find a board where people talk sense. Skimbleshanks what do you use? or is that a cheeky question?
 
I would welcome any opinions regarding 10 and 20 SMA on a 3 or 5 minute chart.
Does anyone believe these are not suitable periods to be working with? If so, please explain why and please feel free to suggest an alternative.

Cheers
 
Last edited:
Dazzam:

Of course it's not a cheeky question, and I'm happy to tell you as you seem a nice and polite sort of fella. :cheesy:

Over the years I've used lots of different types of moving averages, and never really felt happy using them. I've used 10 and 20 EMA (exponential moving average) on daily charts, then 5 and 17, and then I had a stage of using 4, 9, 18 in the way I described above. The Scot Lowry book details something he calls the Delphic Phenomenon, which is basically recognising a pattern formed by the 4, 18, 40 moving averages. All his examples (and the book is comprised mostly of examples) are in commodities and on daily charts. I used this reasonably successfully (not brilliantly though, but OK) on 5 minute Dow charts.

But my most successful trades were always pattern-based - spotting and trading pennants and flags on the Dow, with just a very basic knowledge of Elliott Waves (I just know the 5 wave formation inside out and the other way around).

And from there I gradually evolved into looking at the price bars themselves, and that is what I am using now. No indicators, no moving averages, just stark naked charts!

Moving averages are a good prop for beginners though, so you shouldn't discard them based on what I've said. They're excellent for helping you stay on the correct side of a trend, so that you don't inadvertently short in an uptrend, etc.

The longer term MAs, such as 50 day and 200 day, are invaluable for longer term holds. Just buying when a stock price closes and holds above the 200 day MA and selling when it dropped below it, would beat handsomely the annual returns of any of the pension funds. Stocks also bounce off the 50 and 200 daily MAs quite often, which is spooky.

You just need to decide what time frame you are happiest using (intraday, daily, weekly, etc) and then play around with some until you find what suits you. There is no definitive answer as to what to use if you are looking at lots of stocks.

However, if you are using just one stock or index, then it can be useful to optimise a moving average for that particular stock. Just put lots of them on a chart, and see visually which one(s) it obeys regularly - then that is the one to use.

As an example, the following is the Dow Jones index on a daily chart, with the 50 daily EMA and the 200 daily EMA.

Skim
 

Attachments

  • dow new 50 + 200.jpg
    dow new 50 + 200.jpg
    93.3 KB · Views: 1,414
In case anyone is interested, following on from my post above, below is the daily chart of the Dow showing the Delphic Phenomenon.

Skim
 

Attachments

  • dow jones delphic.jpg
    dow jones delphic.jpg
    65.7 KB · Views: 1,722
Hi Skim

err the first chart you posted. Are the labels the wrong way around for the 2 MA's :confused:

I hope so, otherwise I'm losing the plot....again :eek:
 
LOL - yes they are! I was, of course, just seeing if anyone was paying attention.

And I've just deleted the original, so I'll have to create it again and repost it.

FB - mwah!
 
Are you sure Skim? I see the short line as the 50ma still.

Either that or I need more carrots
 
AArrrrrrrrrrgggghhhhhhh.
Just after I posted, the damn charts changed. Too quick again.
My bad Skim. (As my daughter says.)
 
FB. What are you still doing on here. It's 7.30 on a Saturday night,
You should be getting ready to go down the pub m8 :LOL:
 
Skimbleshanks said:

FB - mwah!
:eek:
<hr>

Hiya Options

I'll have to believe you on the whole My bad thing comment - the youth of today ah.
I won't go to the pub tonight. Not worth it, so far I've got 1 kiss today so I'm taking my profits :cheesy: :LOL:
 
Okay m8, Let's try something out if your staying in and on line.
pop in the trading room and have a rel time chat with me. It's been a long time since we have spoken.
See you there if you are still on.
 
Top