You are using an out of date browser. It may not display this or other websites correctly.
You should upgrade or use an alternative browser.
You should upgrade or use an alternative browser.
My S&P levels for today. Pls see report attached.
S&P held trend line support at 1536 but below 1535 risks a move back to 1530/29. We could expect a floor here today but if we continue lower look for 1526 then better support at 1521/20 which could be a very good buying opportunity this week.
1543/45 could hold the topside again today but above here look for 1548 then 1551. We could see 1555/58 before the end of this month now after this week’s breakout which takes us back to Oct 2007 levels but the high of 2000 at 1574 & all time high of 1586 seen in October 2007 are our ultimate targets.
Attachments
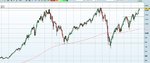
The S&P is looks to be gunning for that1550 level.
Probably the 1580 area.
It needs to seriously hold those levels, because if it fails there, then Houston we have a problem, because would this be a triple top?
Whats throwing me is the time frame, not sure if triple tops work over a long time frame like this, but maybe someone else would know.
This is a Monthly chart of the S&P going back to the mid 90s to present.
We're not far away from those levels at all, the problem lies in what happens if we don't break and hold them.
😱
Attachments
Last edited by a moderator:

S&P 500
1h http://www.bedaytrader.com/images/charts/sp170513h.png
1d http://www.bedaytrader.com/images/charts/sp170513d.png
1w http://www.bedaytrader.com/images/charts/sp170513w.png
Nasdaq 100
1w http://www.bedaytrader.com/images/charts/ndx170513w.png
1m http://www.bedaytrader.com/images/charts/ndx170513m.png
Similar threads
- Replies
- 1
- Views
- 2K
P
- Replies
- 2K
- Views
- 234K
P