Pat494
Legendary member
- Messages
- 14,614
- Likes
- 1,588
What's going on with your stops Pat?
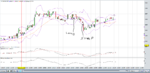
I use small stops and they get taken out, so I double them - still taken out. I have had them below the bollinger band - same result.
If I put them really low like 1200 for a long then I find I am in a hole and getting worse so sell out.
Usual story I reckon.
Do you like my soution to the world's problems ?
Why not every country put 10% of their military budget into the UN and clean up the planet, feed the starving etc. ?