Bouncing from the sell-off in May, the index has risen with great vehemence.
Area 1000 was very close and now we are at the highest of the year.
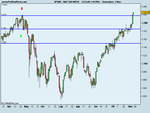
Weekly green close at 1225.85 and good support at 1218.
Likely retest of this last price.
Trend up until at least 1185.
Chart daily (courtesy of ProRealTime.com)