the blades
Experienced member
- Messages
- 1,336
- Likes
- 275
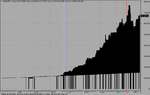
I've set up the backtest to trade at next day open - Sharing Chorlton's concerns.
There's some -ve returns in there for only a few minor tweeks in the parameters - I strongly sniff curve fitting.
I will try to do some walk forward analysis to test this.
Chorlton - do you know how I can set up a watchlist of S&P500 stocks. I'm currently set-up with the entire database. I don't know the S&P constituents and want to avoid adding them to a list one by one, if possible. Doing this will reduce the test time significantly, and weed out tiddlers which might have prohibitive spreads. It should also bring results in line with Suthers. I'm aslo not getting an equity plot - any ideas how to generate this. I'm sure it used to happen automatically without any code - now I get the pane in the chart, but with an error message.
Code;
Range1 = Optimize("Range1",200,150,250,50);
Range2 = Optimize("Range2",2,2,3,1);
Range3 = Optimize("Range3",2,2,3,1);
Range4 = Optimize("Range4",0.97,0.97,0.97,0.1);
Range5 = Optimize("Range5",5,4,6,1);
BuySig = Close > MA( Close , Range1)
AND RSI( range2 ) < range3;
// 3% limit order on close price
Buy = (Ref(BuySig,-1)==1) AND (L<range4*Ref(C,-1));
BuyPrice = range4*Ref(C,-1);
Sell = Close > MA( Close , range5 );
Short = 0;
Cover = 0;
Buy=ExRem(Buy,Sell);
Sell=ExRem(Sell,Buy);
e = Equity();
Plot(e,"Equity",colorRed,styleLine|styleOwnScale);
UTB
Attachments
Last edited: