Will Duxon
Active member
- Messages
- 175
- Likes
- 4
Last week I experimented with matching my own chart setups with a Parabolic SAR/MACD Forex Scalping Strategy that worked out pretty well, so this week I’m going to take a crack at that same sort of thing by matching my own setup with a Stochastic Oscillator and RSI Strategy.

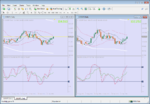
Using D1 charts, I will enter positions in conjunction with the first candlestick that opens and closes inside (and is completely encased within) the intermediate (blue) envelope as price moves back in the direction of the trend after having spent time to the outside of the envelope and opposite the trend (see the small red circle in the chart on the left-hand side of the screen capture).
I will take profit in conjunction with the first candlestick that opens and closes inside (and is completely encased within) the intermediate envelope as price moves against the trend after having spent time on the “trend side” of the intermediate envelope.
Note that I initially thought my exit would have been at the long candlestick that I circled in red, but then I saw a little red candle that already met the Take Profit criteria (where I drew the red arrow). Note also that my system would have had me enter the trade two candlesticks later than the Stochastic Oscillator/RSI Strategy (compare with the entry candle [red circle] in the chart on the right-hand side of the image).
I’ve run into a conundrum however in that I don’t really have a way of deciding where to take profit with respect to the Stochastic/RSI System, but as for my stop losses, I will place them slightly above or below the nearest local high or low respectively.
(I picked GBPJPY at random and found I had to go back to August 2014 to find the first example where the RSI clearly entered and exited the oversold (or overbought) zone on a GBPJPY D1 chart opposite the trend. Perhaps I missed a more recent example due to not taking my time, but in any case, I think I’ll begin looking for opportunities to apply this strategy to H1 charts as well.)
Last edited:


