Relative Strength Trading

I want to hear your opinion. For me, this approach has worked well till now. It combines strength with basic Technical Analysis.
For me, you are losing somewhat the momentum effect
Antonacci uses momentum, you are using (in this case) a breakout of resistance as an entry criteria. these are different forms of TA to enter a trade. Not sure if you've done a study (backtested) what you are doing, to one of a pure momentum strategy where you look to enter based on the momentum of the sectors and then rotate
 
surely whats interesting is tracking ST performance where the ST comes BACK into +ve with a decent LT record ?
 
The strongest stocks in the S&P500

View attachment 290304

Here we can see that the stocks that are strong long-term and have also positive short-term strength are ALGN and PWR.

for example the really interesting ones for me are the big LT performers getting slammed ST......

LB
SIG
FDX
NVD

but maybe i still Look at things a different way to most ......(as i have always done on Forex)

N
 
For me, you are losing somewhat the momentum effect
Antonacci uses momentum, you are using (in this case) a breakout of resistance as an entry criteria. these are different forms of TA to enter a trade. Not sure if you've done a study (backtested) what you are doing, to one of a pure momentum strategy where you look to enter based on the momentum of the sectors and then rotate

I think I should explain my approach in some more detail.

First of all, I use the well-researched finding which postulates that securities which have shown strength in the past will continue being strong in the future. That's why I constructed the graph with the strongest stocks both long-term and short-term.

This chart ranks the stocks in descending order according to their long-term (momentum) strength - the blue bars. The short-term (momentum) strength then helps me decide which of the strong (long-term) stocks show (short-term) strength as well.

My approach then goes a step further. As you can see, both ALGN and PWR are strong in both timeframes (short and long). Instead, however, of investing blindly in these two stocks, some simple TA indicates that PWR has better chances to move up than ALGN.

To sum up, from the stocks that have been strong in the past, I use simple TA as a second filter, to pick up the stocks that look more promising.

I hope I've made my approach quite clear, and I'm looking forward to your comments.
I get your strategy, its slightly different to what i thought it was going to be thats all.
when we reference Antonacci, we look at a rotational method based on the relative strength, where the relative strength is measured in terms of its momentum. there is a trend aspect, which antonacci again uses a positive momentum calculated over 12 months.
I'm not going to knock your strategy in the slightest, its yours. and its so easy for people to criticise others when they fail to even propose an alternative. I still respect and admire what you're doing.
anyway look, enough with my needless comments. this is your thread, knock it out of the park mate!
 
November 6th: The strongest US Sector ETFs
SEC.jpg


This diagram shows the strongest US Sectors, namely XLY, XLB, XLC, XLY, and XLI.

We can focus on these sectors. We either buy the corresponding Sector ETFs or choose stocks from these sectors
 
November 27th update: The strongest stocks in the S&P100
We calculate the long- and short-term strength using a combination of appropriate momentum readings.

It’s a simple and objective way to choose strong stocks and profit from their strength.

You can use either the long-term or the short-term strength, or a combination of them that suits your strategy and time horizon.

100.jpg
 
November 27th update: The strongest stocks in the S&P500
We calculate the long- and short-term strength using a combination of appropriate momentum readings.

It’s a simple and objective way to choose strong stocks and profit from their strength.

You can use either the long-term or the short-term strength, or a combination of them that suits your strategy and time horizon.
500.jpg
 
December 4th update: The strongest stocks in the S&P100
100.jpg

S&P100 – one of the strongest stocks

101.jpg
 
December 4th update: S&P500 – The strongest stocks in the S&P500
500.jpg

December 4th update: S&P500 – one of the strongest stocks

501.jpg
 
My approach is based on the findings of research that securities that have been strong in the past will likely be strong in the future. Lots of Asset Allocation strategies are based on this well-documented finding.

I can mention Gary Antonacci's "Dual Momentum" explained in his official site https://dualmomentum.net/

I decided to use the same approach but with stocks instead of ETFs he's using.

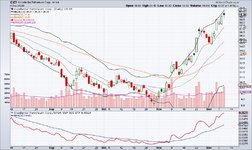
I measured the momentum of the stocks contained in various Indexes, such as S&P 100, 400, 500 & 600, as well as NASDAQ, and I constructed charts like the one below:

tView attachment 290269

Both the long-term and the short-term are a combination of momentums at different time intervals.
I use these charts to choose stocks that have shown a satisfying combination of long- and short-term strength.

I post these charts, as well as some information I find useful, on my site: www.globalactivetrading.com

I'll be glad if you visit the site and tell me what you think. I'll be happy to answer any questions.

Any comments are welcome!

Thanks!
i will takea look ....thanks ...N
 
December 9th update: The strongest stocks in the S&P500

50.jpg


See below one of the strongest stocks shown in the above diagram:

51.jpg
 
December 10th update: The strongest stocks in the S&P100
100.jpg


101.jpg
 

Attachments

  • 101.jpg
    101.jpg
    232 KB · Views: 151
December 10th update: The strongest stocks in the S&P500
500.jpg

See below one of the strongest stocks shown in the above diagram:
501.jpg
 
December 11th update: The Relative Strength of the 11 US Sector ETFs
We can invest directly in the strongest Sectors.

Alternatively, we can choose stocks from the Sectors that show long-term and/or short-term strength.

Research shows that 80% of the profits come from the 20% of the strongest securities.
SEC.jpg


SECA.jpg
 
December 11th update: The strongest Index ETFs

WOR.jpg

See below one of the strongest Index ETFs taken from the above diagram

WORA.jpg
 
December 12th update: The strongest stocks in the S&P500

500.jpg

See below one of the strongest stocks taken from the above diagram
501.jpg

 
Top