You are using an out of date browser. It may not display this or other websites correctly.
You should upgrade or use an alternative browser.
You should upgrade or use an alternative browser.
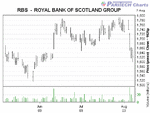
RBS is becoming quite tradeable again. 1620 area seems to be providing reasonable support for now off the DT at 1780. Next supprt level is 1550. Given the recent falls it is likley to bounce first from here I think. Indicators would suggest that we will go up at the start of the week ( 18/08 ). 1660 would be my first target. The one problem I see creeping in is how high the FTSE will go before it has a retrace. Have been trading it again recently and will do this week as well.
barjon
Legendary member
- Messages
- 10,752
- Likes
- 1,863
kevin
yes, I agree- been long since third failed attempt to close the
10/11 June gap (1620 and didn't regard Thursday 1619 as a
penetration). Looking for 1690 but will run if there's a close
below 1615 ( assuming there's no sharp intraday down
that exits me before that)
good trading
jon
yes, I agree- been long since third failed attempt to close the
10/11 June gap (1620 and didn't regard Thursday 1619 as a
penetration). Looking for 1690 but will run if there's a close
below 1615 ( assuming there's no sharp intraday down
that exits me before that)
good trading
jon
barjon
Legendary member
- Messages
- 10,752
- Likes
- 1,863
Hi money
all the big banks took something of a hit today with HSBC and
RBS the worst.
Looks pretty weak to me now 1620 has gone (tho' it's only one
day) unless it jumps back quickly. If not, can't see much support
on the chart 'til around 1550/1520. Don't know if your trade is
long, medium or short term. Expect you'll be watching it very
closely if it's short term.
good trading
jon
Very difficult to trade RBS when the markets are near static. Very frustrating. Wll just have to leave it for now as the risk is not worth the return. For anyone long from 1580 ish I would expect abounce of sorts on Thursday. US not ready to collapse just yet and FTSE likely to be pulled up by the fact that US markets appear to want higher in the short term.
Kevin.
Kevin.
barjon
Legendary member
- Messages
- 10,752
- Likes
- 1,863
Fluke
Probably a bit late now, but I've been away.
The bounce was a hopeful sign near a support area - with the
May low @ 1516 and fib 50 support @ around 1510 (almost co-
incident with the double top target measure of around 1504).
However, I won't be convinced the intermediate down trend has
changed until there's a significant move above 1612 which I have
as a swing reaction high on 8 May (followed idc by a move
beyond fib 50 resistance @ around 1660 - by which time your
long will have made a few bob of course!!!)
My system gives me a short signal if there's a close below 8 May
low 1570 (assuming it stays below 1612) but I doubt I'll trade it
because it's a bit close to the support area for comfort.
All imo of course. All the fancy analysis in the world won't impress
the market - it'll go where it will, with us (hopefully) hanging on
its coat tails.
good trading
jon
Similar threads
- Replies
- 11
- Views
- 9K