barjon
Legendary member
- Messages
- 10,752
- Likes
- 1,863
Time for another look at RBS.
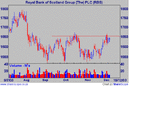
there's a lot happening at the 1515 - 1530 level with a firm
support base established - via the tails of hammers on 14/4
and 21/5 the sept lows and the bottom of the recent congestion
area; and fib 50 support.
It retreated from fib50 resistance in october and having explored
higher ground on Thursday and Friday from a 3 week congestion
band it stalled on both occasions at 1614 and retreated from the
new fib50 resistance. Nonetheless it's holding just about at the
top of that 3 wk congestion band.
A further slip to around 1580 and there may be 40 short points in
view? Conversely, a hold above 1614 might see 40 long points?
jon
ps sorry about poor quality of chart - haven't got this posting
quite worked out yet 🙄


