price action

price777999

Established member
Messages
582
Likes
29
I keep reading posts of people saying 'forget the indicators all you need is price action'

what does this actually mean :?:

could anyone post an example of a trade using just price action :?:
 
When a price rejects a level in a way the momentum keeps it moving in the opposite direction;
or when a price continually retests a level till it breaks.

Thoughts?

(A pin bar could be an example of a rejection).

Edit: I hate your avatar, it creeps me out.
Edit2: Watch tick charts (y)
 
Last edited:
I keep reading posts of people saying 'forget the indicators all you need is price action'

what does this actually mean :?:

could anyone post an example of a trade using just price action :?:


Get a thread going, or a private forum. You can call it, "No price, no chat, just indicators".:LOL:
 
The thing is, indicator freaks 'need' price to prove them right, which is a bit contradictory to say the least.

Indicator users don't know what side thier bread is buttered on, t*ssers.

Don't bother starting a thread, it'll all be tweaked up anyway.

What's the old saying? If you can't make price work, tweak the indicator, if that don't work, take up religion. Blind faith can be moulded to suit the individual, as long as it's faith and blind.
 
2008-11-06_0039.png


so these would be price action trades ?
 
I keep reading posts of people saying 'forget the indicators all you need is price action'

what does this actually mean :?:

could anyone post an example of a trade using just price action :?:
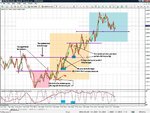
price777999,
I stole the chart I attached from the "just charts..." group.
I outlined some things on that chart to give an idea of trading with just price.
I personally like to trade with price and time but as you asked for a "price" example that's whats on the chart.
I hope it helps:)
 

Attachments

  • gu-nov04a1.JPG
    gu-nov04a1.JPG
    247.1 KB · Views: 12,657
Last edited:
brilliant cheers Hwsteele & Foredog.........more examples of price action still welcome .

is my example correct ?
 
2008-11-06_0039.png


so these would be price action trades ?

In that first chart when price quickly briefly that upper resistence level and then was instantly sucked back down into that trading range to me is a sign of weakness. With that in mind i may have entered on the break of that first support but mostly likley on a retractment. all in hindsight ofcourse which is always helpful.:rolleyes:
 
well this price action thing isn't working for me today .


3009861551_949bb5f77d_o.png
 
Last edited:
You are more than welcome. It just takes some practice that's all. You will never be perfect at it as there is always something you will notice after the fact, but the more you do it the easier it gets.
 
The thing is, indicator freaks 'need' price to prove them right, which is a bit contradictory to say the least.

Indicator users don't know what side thier bread is buttered on, t*ssers.

Don't bother starting a thread, it'll all be tweaked up anyway.

What's the old saying? If you can't make price work, tweak the indicator, if that don't work, take up religion. Blind faith can be moulded to suit the individual, as long as it's faith and blind.

brilliant reply ...
 
What happens next?

Times on the chart are CME time.
 

Attachments

  • 001.bmp
    2.1 MB · Views: 343
Times on the chart are CME time.

That's a good question!!
It was trading in a bit of a range at the end of the chart so it's hard to say.
That could be a small double top and a pull back to about 1275 or just a half way there type pause up to 1288.
 
Top