tkpower8
Junior member
- Messages
- 44
- Likes
- 4
Hello T2W Members,
I would like to start this thread to discuss trading Forex using nothing but Price Action, some people like to call it Naked Trading but I am dressed so I will stick with Price Action Trading 😉
THIS IS A SET AND FORGET APPROACH TO TRADING THE MARKET ACCURATELY WITH LESS TIME STARING AT CHARTS AND THEREFORE LESS EMOTION
My first message will be to Newbies:
You are actually very lucky in some respects. You have a fresh perspective, do NOT cloud your new fresh Forex eyes with silly Indicators and squiggly lines. Everything you need to know lies within the price charts themselves. It keeps it very simple, gives you accurate information to base your decisions on without needing all the planets to align.
If you are not a Newbie:
Even if you have been working with fancy Indicators I implore you to focus more on Price Action. Unless of course you have something that works for you continuously throughout all the different market conditions. If you do then perhaps having extensive knowledge of Price Action concepts will help you to become even more accurate. Either way this thread will contain no Indicators.
Moving on....
I will introduce you to what I mean briefly then wait to see who is interested in hearing my opinions on trading, please post your interest and I will gladly continue the thread .
What exactly do I mean by Price Action and how do I trade?
Price Action is a massive topic that will take many posts and many questions but in summary price action can be broken down like this.
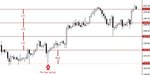
Support/Resistance (SR):
Also know as Supply and Demand, SR are simply areas on your chart where price is likely to change direction. SR could be traded all by itself if you were smart about your Money Management and Risk Reward but in my world it is just 1 of the core price action concepts that I combine.
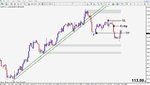
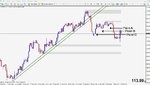
Trend Lines (TL's):
Trend Lines can be very accurate tools but it is important to only place them when there is an obvious trend being born. They can be looked at as Angled SR and I like to use TL zones instead of single TL's just as I look at SR as a small area and not just a single price.
Highs and Lows (PA):
You're probably thinking why have I abbreviated this "PA". The quick answer is that everything else to do with Price Action has it's own name like SR, TL's etc.. so instead of having to say "The highs and lows being made in price swings" or "The swing highs and lows" I just call this price action (PA)
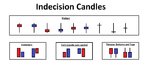
Candlesticks:
I don't need to abbreviate this piece of price action because it is just one word 🙂. Candlesticks are basically little pictures that tell you a small story about a specific period of time. If you use 4 hour charts for example then each candle can, at a glance, tell you a small story about that 4 hours. They will show you when there is Indecision or not. At the correct location (determined by SR, TL's and PA) you can use these little pictures to act as entry triggers.
Psychological Levels (PL's):
A final part of the trade decision process is to check for nearby levels of interest like 1.61000 as a major example. I break this down in to Major, Secondary, and Minor Psychological Levels. This is the final part of the entry point decision and only leaves for you to check the Risk Reward on the trade you are about to enter, make sure it is worth your time.
Money Management (MM):
I like to keep this one simple and generally round it off to safe trading being 0.1lot per $2000 in your account. I occasionally get aggressive and consider 0.1lot per $1000 in your account to be a maximum level of aggression.
Risk/Reward (RR)
This can make or break a trader right here. RR should not be ignored. I mean, what is the point of risking more than are aiming to get? It makes no sense but lots of amateur traders do it anyway. When you trade purely from price action then you have an exact price that you are waiting to enter the market at, you already know what your stop loss (SL) will be and you are able to see what a conservative take profit (TP) is also. This means that before you enter the trade you can judge your RR. If you always maintain that 1:1 minimum then winning 60-70% of your trades will make you a successful trader. However, when trading all these price action concepts I outline you are able to trade with the trend resulting in many trades that are 1:2 or 1:3. If your 1:1 is a minimum but you are trading with the trend and many times you get 1:2 or 1:3 then winning even 50% of your trades makes you a successful trader.
All that said, a 70-80% win rate is obtainable if you maintain a level of patience and discipline.
Well, that is my opening blabber and as I said I would be happy to continue if there is interest.
I have been teaching people all about price action trading for a few years now and I love watching people succeed, I will warn you though that my experience in teaching has shown me that it does take a while for anyone to get all of the price action concepts and get used to using them harmonically together.
I would like to start this thread to discuss trading Forex using nothing but Price Action, some people like to call it Naked Trading but I am dressed so I will stick with Price Action Trading 😉
THIS IS A SET AND FORGET APPROACH TO TRADING THE MARKET ACCURATELY WITH LESS TIME STARING AT CHARTS AND THEREFORE LESS EMOTION
My first message will be to Newbies:
You are actually very lucky in some respects. You have a fresh perspective, do NOT cloud your new fresh Forex eyes with silly Indicators and squiggly lines. Everything you need to know lies within the price charts themselves. It keeps it very simple, gives you accurate information to base your decisions on without needing all the planets to align.
If you are not a Newbie:
Even if you have been working with fancy Indicators I implore you to focus more on Price Action. Unless of course you have something that works for you continuously throughout all the different market conditions. If you do then perhaps having extensive knowledge of Price Action concepts will help you to become even more accurate. Either way this thread will contain no Indicators.
Moving on....
I will introduce you to what I mean briefly then wait to see who is interested in hearing my opinions on trading, please post your interest and I will gladly continue the thread .
What exactly do I mean by Price Action and how do I trade?
Price Action is a massive topic that will take many posts and many questions but in summary price action can be broken down like this.
Support/Resistance (SR):
Also know as Supply and Demand, SR are simply areas on your chart where price is likely to change direction. SR could be traded all by itself if you were smart about your Money Management and Risk Reward but in my world it is just 1 of the core price action concepts that I combine.
Trend Lines (TL's):
Trend Lines can be very accurate tools but it is important to only place them when there is an obvious trend being born. They can be looked at as Angled SR and I like to use TL zones instead of single TL's just as I look at SR as a small area and not just a single price.
Highs and Lows (PA):
You're probably thinking why have I abbreviated this "PA". The quick answer is that everything else to do with Price Action has it's own name like SR, TL's etc.. so instead of having to say "The highs and lows being made in price swings" or "The swing highs and lows" I just call this price action (PA)
Candlesticks:
I don't need to abbreviate this piece of price action because it is just one word 🙂. Candlesticks are basically little pictures that tell you a small story about a specific period of time. If you use 4 hour charts for example then each candle can, at a glance, tell you a small story about that 4 hours. They will show you when there is Indecision or not. At the correct location (determined by SR, TL's and PA) you can use these little pictures to act as entry triggers.
Psychological Levels (PL's):
A final part of the trade decision process is to check for nearby levels of interest like 1.61000 as a major example. I break this down in to Major, Secondary, and Minor Psychological Levels. This is the final part of the entry point decision and only leaves for you to check the Risk Reward on the trade you are about to enter, make sure it is worth your time.
Money Management (MM):
I like to keep this one simple and generally round it off to safe trading being 0.1lot per $2000 in your account. I occasionally get aggressive and consider 0.1lot per $1000 in your account to be a maximum level of aggression.
Risk/Reward (RR)
This can make or break a trader right here. RR should not be ignored. I mean, what is the point of risking more than are aiming to get? It makes no sense but lots of amateur traders do it anyway. When you trade purely from price action then you have an exact price that you are waiting to enter the market at, you already know what your stop loss (SL) will be and you are able to see what a conservative take profit (TP) is also. This means that before you enter the trade you can judge your RR. If you always maintain that 1:1 minimum then winning 60-70% of your trades will make you a successful trader. However, when trading all these price action concepts I outline you are able to trade with the trend resulting in many trades that are 1:2 or 1:3. If your 1:1 is a minimum but you are trading with the trend and many times you get 1:2 or 1:3 then winning even 50% of your trades makes you a successful trader.
All that said, a 70-80% win rate is obtainable if you maintain a level of patience and discipline.
Well, that is my opening blabber and as I said I would be happy to continue if there is interest.
I have been teaching people all about price action trading for a few years now and I love watching people succeed, I will warn you though that my experience in teaching has shown me that it does take a while for anyone to get all of the price action concepts and get used to using them harmonically together.