Price Action Scalping

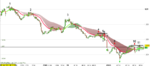
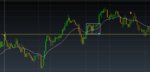
Here is the one and only trade I took Friday after the Non-Farm payrolls numbers were released. The chart is a 70 tick chart along with the 20 ema. Also the chart shows the 20 and 50 sma set up to show crossing information which I tend to ignore except to clarify a long sustained trend.

The block break (BB) trade, entered just below the red line at 7 in the chart, was scratched for a loss at 10. On review the trade mostly looked fine. It looked like a topping pattern had formed, 3-4 and a downward trend was in (3-6) and price action hit the 20 ema twice shortly before 7. On the other hand the ellipse at 1 shows some previous highs that, due to several hours of sideways trading, may have formed some support. Also I should have moved the stop down to the highs of 9, which would have lessend the loss. The 10 pip target was missed by about 2 pips.

The question I have is should the trade have been skipped for any reason? Also were the BB at 5 and the double doji (DD) 6 better trades?

Thanks,
Chart

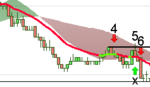
I think it was a valid trade and yes the Sl should had been moved just above 9 (reversal bar at the end of the 8 pips run and 2 higher bottom formed), also seems that it reversed just at the ellipse (1).

Yes, the trade at 4 and 5 is also valid (double top at (3),big drop after that, (bears in control) lower top at (4) and (5), but support at the swing low before (4), which it bounced from to form a possible DD at 6, which I would not be taken (personally) because the way it retraced forming a higher bottom..

Hey, but is all easy in hindsight.

I like they way you detailed the market, it will help you to be engaged in it without a trade.(essential)

Keep in my mind that you need to monitor yourself, what are your emotions, are you getting anxious? impatient? revenge? They need not to be there. How are we going to get reed of them? Just be aware of them and they will dissolve, it may feel uncomfortable at the beginning but after a while they will lose their power because they are not real, but exist only in our little head.
As in meditation to get reed of all the cluttered thoughts we just monitor them.

If you do that (monitoring yourself) it will be easier to get into the flow, so you became the market and viceversa.
 
Last edited:

Attachments

  • w.gif
    w.gif
    46.4 KB · Views: 176
...and yes the Sl should had been moved just above 9 (reversal bar at the end of the 8 pips run and 2 higher bottom formed),

Keep in my mind that you need to monitor yourself, what are your emotions, are you getting anxious? impatient? revenge? They need not to be there. How are we going to get reed of them? Just be aware of them and they will dissolve, it may feel uncomfortable at the beginning but after a while they will lose their power because they are not real, but exist only in our little head.
As in meditation to get reed of all the cluttered thoughts we just monitor them.

If you do that (monitoring yourself) it will be easier to get into the flow, so you became the market and viceversa.

Thanks for the feedback. I agree that monitoring yourself is important. When I did not lower the stop I could sense that I was "hoping" the trade would turn around. Trades get difficult when you just missed your target and it starts moving against you. The higher low was all the information I needed to know that the trade was likely to become a broken one, and I should have at least locked in a better scratch at the technical level.

Thanks again,
Chart
 
Quoting Bob Volman, "The overall picture, at all times, should weigh heavier on the decision-making process than the shape of the setup alone, which, in the end, is no more than a means to get in on the market, and not the reason to."

In the chart you see three lower highs 1-3 and corresponding lower lows, therefore at this time I believe the bears are in control. I took four short trades, at 4, 6, 8 and 10, the first and last were scratches (see x's) while the second and third hit their targets. The first DD (double doji) trade had a tight stop and of course hit it. I picked the trade up again as a BB (block break) trade at 6 hitting the target at 7. The DD trade at 8 hit the target, this trade may have been premature since price action did not hit the 20 ema. The BB trade at 10 may not have been a wise trade since there was a hint of higher lows or at least a clustering of price action at the 1.304 level. Note that I had some previous support and resistance levels in the chart which price action respected quite well and a counter trend long trade off the lower level would have paid off quite well.

Chart
 

Attachments

  • eur-usd-2-8-12-4shorts.PNG
    eur-usd-2-8-12-4shorts.PNG
    29 KB · Views: 259
Thanks for the feedback. I agree that monitoring yourself is important. When I did not lower the stop I could sense that I was "hoping" the trade would turn around. Trades get difficult when you just missed your target and it starts moving against you. The higher low was all the information I needed to know that the trade was likely to become a broken one, and I should have at least locked in a better scratch at the technical level.

Thanks again,
Chart

I think this is a good post, you are taken responsibility for your own.

As I said is easier in hindsight, but probably I would not be taken the trade if the support line above the eclipse was still there or I would have taken the 8 pips profit at the touch of that support. I do that often.
 
Quoting Bob Volman, "The overall picture, at all times, should weigh heavier on the decision-making process than the shape of the setup alone, which, in the end, is no more than a means to get in on the market, and not the reason to."

In the chart you see three lower highs 1-3 and corresponding lower lows, therefore at this time I believe the bears are in control. I took four short trades, at 4, 6, 8 and 10, the first and last were scratches (see x's) while the second and third hit their targets. The first DD (double doji) trade had a tight stop and of course hit it. I picked the trade up again as a BB (block break) trade at 6 hitting the target at 7. The DD trade at 8 hit the target, this trade may have been premature since price action did not hit the 20 ema. The BB trade at 10 may not have been a wise trade since there was a hint of higher lows or at least a clustering of price action at the 1.304 level. Note that I had some previous support and resistance levels in the chart which price action respected quite well and a counter trend long trade off the lower level would have paid off quite well.

Chart

Nice.

I can tell that you are working hard and you did your homework.

I would not take the trade at 4 because of the pullback, I do not like to see an higher bottom with that setup.

I would at 6 and also at 8 (that could be a FB).

Definitely not at 10 (two higher bottoms).

If I may, I would suggest to try to find a reason to not take a trade instead of finding a reason to take a trade. We need to be selective in our trades and at the same time not to get upset when you miss a run.

How many time you read the book? I suggest that you write down all the important point and make your own documents and make specific guides when to enter and when not, read them before you start to trade until they are impregnated in your make up, I say guides and not rules because you need to add some of your flavour, things that YOU feel comfortable with.

For example my self I do not trail my stop, I like to give a bit of space, my risk is already less than my profit, so I am comfortable with that, I also do not wait every time that either my SL or TP is triggered, if I see a double bottom or other I get out.
 
Last edited:
That was a nice squeeze at the 1.3060 level, didn't take it though:(
Especially after bears were defeated at round number level.
Always will be another opportunity.
 

Attachments

  • eur-usd-4-9-12-squeeze at 3060.PNG
    eur-usd-4-9-12-squeeze at 3060.PNG
    8.7 KB · Views: 227
Last edited:
If I may, I would suggest to try to find a reason to not take a trade instead of finding a reason to take a trade. We need to be selective in our trades and at the same time not to get upset when you miss a run.

Great advice, I definitely need more filtering, thanks.

How many time you read the book? I suggest that you write down all the important point and make your own documents and make specific guides when to enter and when not, read them before you start to trade until they are impregnated in your make up, I say guides and not rules because you need to add some of your flavour, things that YOU feel comfortable with.

I read the book once and have went back through just rereading the highlights. I plan on rereading it, taking more serious notes. Condensing it into a guide like document is a great idea. I'll eventually do the same with some other books as well. Then I suppose eventually a "master guide" for myself.

For example my self I do not trail my stop, I like to give a bit of space, my risk is already less than my profit, so I am comfortable with that, I also do not wait every time that either my SL or TP is triggered, if I see a double bottom or other I get out.

That's a good way to do it if you can trust your decisions. I see Bob's point as well which simplifies things. At this point in time both the simplicity and the concreteness of Bob's method works for me. I'll give it some more leeway later on when I am more comfortable.
Chart
 
I would not take the trade at 4 because of the pullback, I do not like to see an higher bottom with that setup.

Something quick to add about that DD setup quoting Bob Volman (p. 80), "And as is the case with most with-trend plays, no matter how inviting the trend in the chart at hand, ultimately it is the shape of the pullback that has the biggest say to the matter of participation."

Wonder if the kind of sideways PA after the bottom indicates a problem?
 

Attachments

  • eur-usd-shapeofpullback.PNG
    eur-usd-shapeofpullback.PNG
    3.7 KB · Views: 201
Something quick to add about that DD setup quoting Bob Volman (p. 80), "And as is the case with most with-trend plays, no matter how inviting the trend in the chart at hand, ultimately it is the shape of the pullback that has the biggest say to the matter of participation."

Wonder if the kind of sideways PA after the bottom indicates a problem?

Yes, in my view it does, specially for a DD, less for a SB or BB.
 
Easy job.

Keep in mind that I was looking at the market of at least 3 hours, once in, the trade took not more than 5 minutes to get to target. Can you do that? Can you look at the market without trading? If yes, this could also be your way, if not, better to find a way that is compatible with your personality.

Anyway 2% in the pocket.
 
Yes let me know how thing work with Ninja, I am interested, is Ninja Free?

I am also looking at Hirose, spread are good as well, I own a charting software, Amibroker (which is very affordable) and seems that Amibroker can read their data thought DDE, for the tick charts.

I know nothing about all this, I am learning as it goes, I was trying yesterday to connect but without luck, you are an IT, see if you can make sense of it.

Hey, I am back :)
Ninja is not free, only for demo, so I will skip it for now.
Mike. I thought you use ProRealTime for charting? Any if you use Amibroker, they probably offer tick feed by themself, don't they?
Anyway I can try to connect them to Hirose but would need some studying - let's put this to PM/mail..
 
Hello everyone,

This is an excellent thread. Looks like it can help me gain some insight and hope to make some useful contributions as well.

I noticed the thread discusses methods in Bob Volman's excellent book which I am trying to employ. Currently I am trying to learn how to read the charts as he does in the book and am taking some very small trades. Looks like it might be a grind for a couple of months before I (hopefully) get the upper hand. My current difficulty is in detecting "Unfavorable Conditions", which I think is leading to my overtrading and also to seeing my trades fall just a couple pip short of the target.

Thanks in advance for any help, I'll spend some more time reading back through the posts and try to post a trade or two myself.

Charticist


Hey Chartman,
warm welcome from my side also. It seems that we are on similar road, nice to have a companion. Still reading Bob's book, every page gets me new ideas.
Looking forward for your trade setups...
 
first trade today, block break buy after pullback, nice squeeze by EMA. Missed my 9 pips TP by 2 pips, closed it for 2 pip profit. Was counting on Vacuum effect (1.31 level) to suck the trade up but it did not. Moving to next one...
 

Attachments

  • trade11-2pipWIN.PNG
    trade11-2pipWIN.PNG
    53.3 KB · Views: 206
first trade today, block break buy after pullback, nice squeeze by EMA. Missed my 9 pips TP by 2 pips, closed it for 2 pip profit. Was counting on Vacuum effect (1.31 level) to suck the trade up but it did not. Moving to next one...

Nice and nimble.
 
Top