Commentary for price action of GBP-USD, EUR-GBP, EUR-USD and USD-CAD about their respective VRM levels on 12 May 2022.
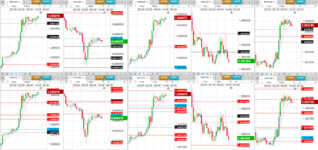
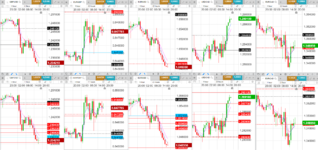
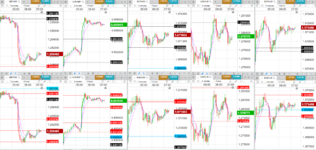
Price action shown in attached charts together with VRM predicted levels.
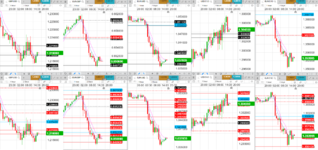
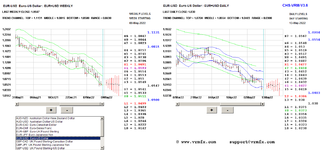
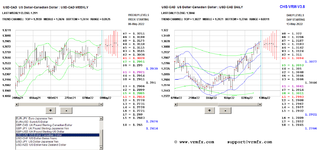
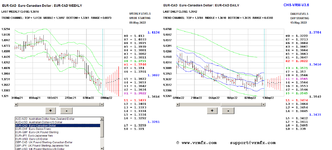
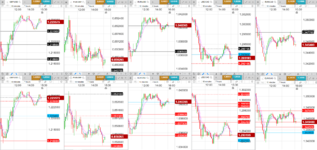
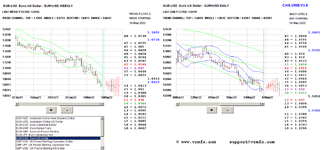
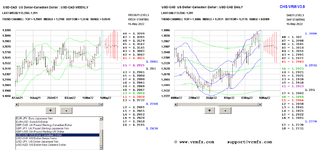
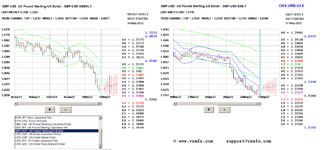
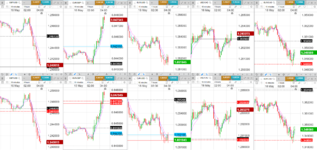
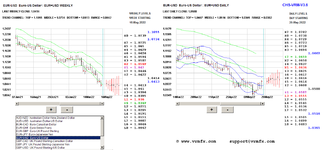
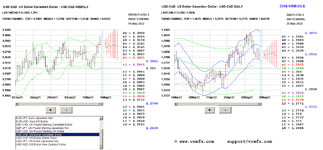
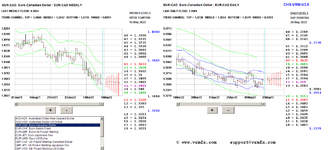
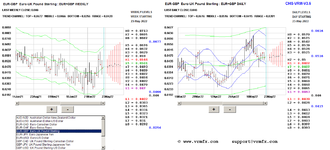
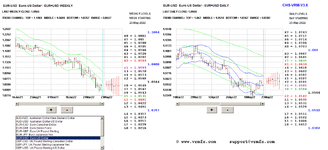
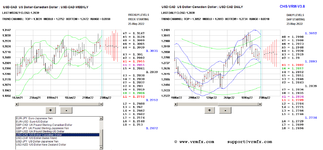
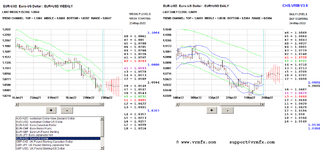
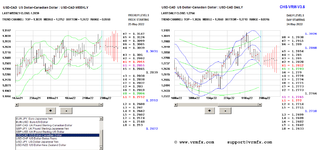
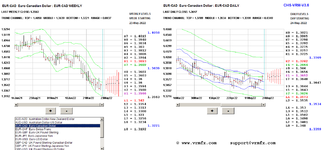
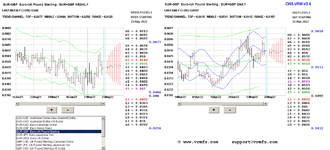
In these charts H and L levels are solid lines, sentiment levels are dashed lines. Top, middle and bottom of trend channels are coloured blue.
Markets opened 18:00 in the attached charts.
Weekly VRM levels in the top charts. Daily VRM levels in the bottom charts
==============================================================
MAJOR NEWS TODAY
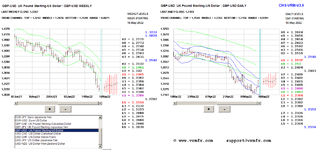
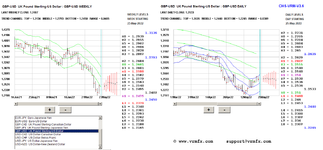
03:00 UK GDP figures
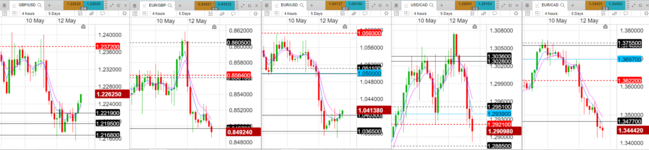
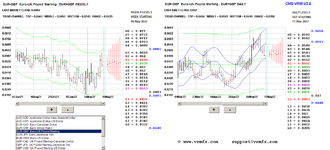
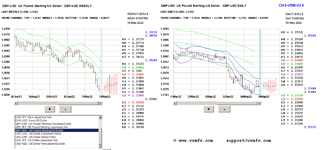
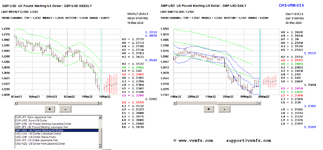
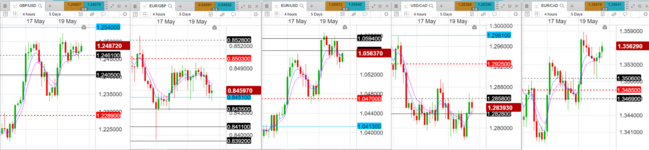
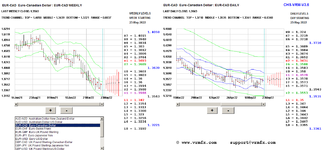
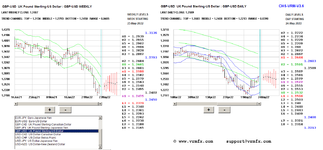
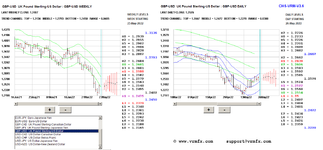
GBP-USD started the session trapped amongst its VRM weekly and daily L levels. In fact GBP-USD tried to break back inside its short term trend channel at 1.2234 and failed. This left EUR-GBP and EUR-USD to make their moves.
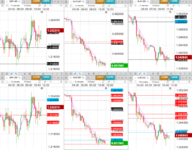
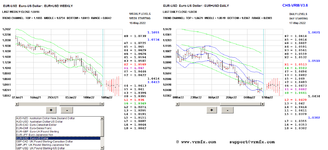
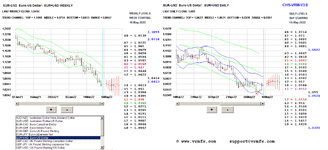
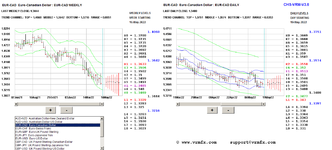
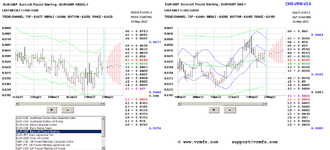
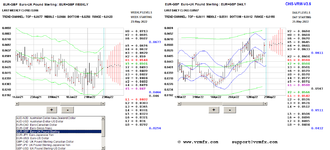
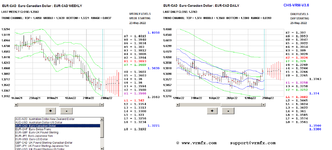
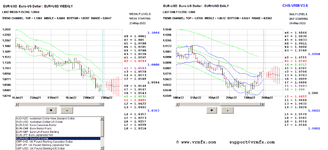
On the UK GDP figures EUR-GBP tried to break up through the top of its short term trend channel at 0.8619 and failed. I have EUR-GBP high for the day as 0.86196. I would say that was a bullseye. EUR-GBP then fell to the middle of its short term trend channel at 0.8522.
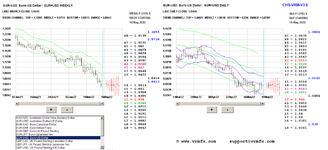
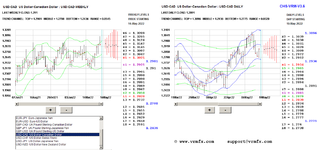
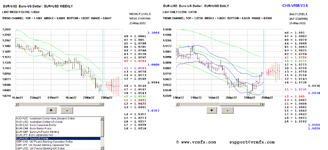
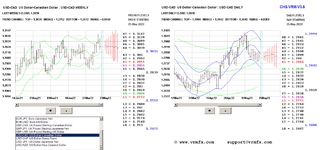
EUR-USD followed EUR-GBP and fell to its weekly L level 1.0403.
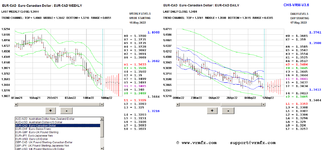
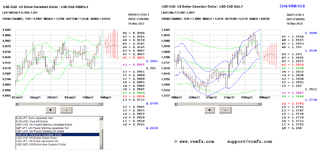
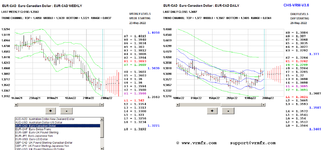
Interestingly EUR-CAD made its daily high at the middle of its long term trend channel at 1.3697 when EUR-GBP made its daily high. All the FX pairs are connected. This is a good example.
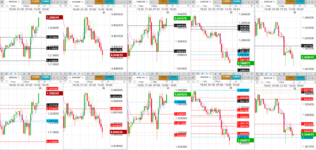
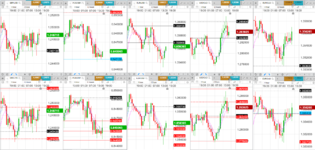
Lots of short trading opportunities for EUR-GBP and EUR-USD between VRM levels.
ATTACHED
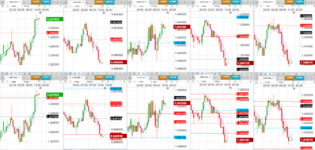
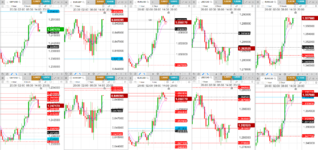
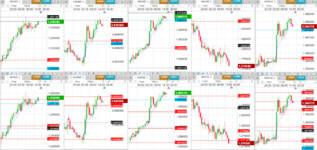
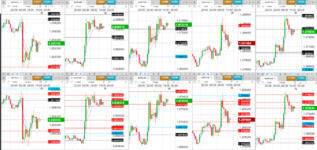
1 hour charts
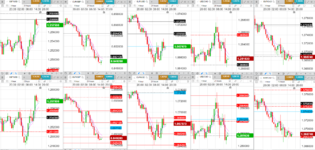
15 minute charts starting at the UK GDP figures
============================================================
For a description of the VRM and a PDF describing the VRM charts attached see this link...
G
Price action shown in attached charts together with VRM predicted levels.
In these charts H and L levels are solid lines, sentiment levels are dashed lines. Top, middle and bottom of trend channels are coloured blue.
Markets opened 18:00 in the attached charts.
Weekly VRM levels in the top charts. Daily VRM levels in the bottom charts
==============================================================
MAJOR NEWS TODAY
03:00 UK GDP figures
GBP-USD started the session trapped amongst its VRM weekly and daily L levels. In fact GBP-USD tried to break back inside its short term trend channel at 1.2234 and failed. This left EUR-GBP and EUR-USD to make their moves.
On the UK GDP figures EUR-GBP tried to break up through the top of its short term trend channel at 0.8619 and failed. I have EUR-GBP high for the day as 0.86196. I would say that was a bullseye. EUR-GBP then fell to the middle of its short term trend channel at 0.8522.
EUR-USD followed EUR-GBP and fell to its weekly L level 1.0403.
Interestingly EUR-CAD made its daily high at the middle of its long term trend channel at 1.3697 when EUR-GBP made its daily high. All the FX pairs are connected. This is a good example.
Lots of short trading opportunities for EUR-GBP and EUR-USD between VRM levels.
ATTACHED
1 hour charts
15 minute charts starting at the UK GDP figures
============================================================
For a description of the VRM and a PDF describing the VRM charts attached see this link...
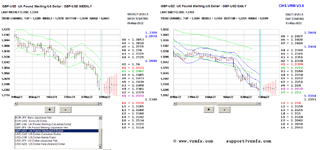
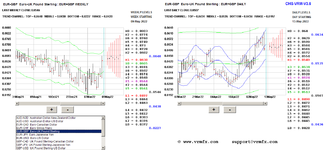
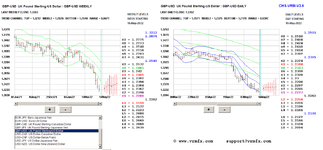
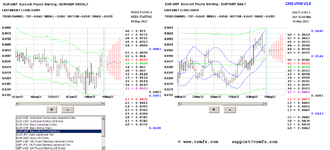
Predicting future FX support and resistance levels using mathematics
I attach the VRM predictions for tomorrow for 16th July for GBPUSD, EURGBP, EURUSD, USDCAD & EURCAD. Coloured levels are the important VRM levels. Watch out for the top, middle and bottom of the short term trend channel (blue) colliding with the top, middle or bottom of the long term trend...
www.trade2win.com
G