Predicting future FX support and resistance levels using mathematics

I attach the VRM predictions for tomorrow for 16th July for GBPUSD, EURGBP, EURUSD, USDCAD & EURCAD.

Coloured levels are the important VRM levels. Watch out for the top, middle and bottom of the short term trend channel (blue) colliding with the top, middle or bottom of the long term trend channel (green).

I also attach VRM charts for AUDUSD, USDNZD and AUDNZD for 16th July. Study the VRM levels of each FX pair of the triplet to make your final trading decsion. I do not chart these FX pairs so will not present the results tomorrow.

==================== AUDUSD, USDNZD & AUDNZD LAST THREE CHARTS =======================
 

Attachments

  • gbpusd.PNG
    gbpusd.PNG
    63.6 KB · Views: 175
  • eurgbp.PNG
    eurgbp.PNG
    62.7 KB · Views: 175
  • eurusd.PNG
    eurusd.PNG
    61.7 KB · Views: 176
  • usdcad.PNG
    usdcad.PNG
    61.1 KB · Views: 181
  • eurcad.PNG
    eurcad.PNG
    59.7 KB · Views: 184
  • audusd.PNG
    audusd.PNG
    60.1 KB · Views: 184
  • usdnzd.PNG
    usdnzd.PNG
    61.4 KB · Views: 174
  • audnzd.PNG
    audnzd.PNG
    61.3 KB · Views: 170
GBPUSD, EURGBP, EURUSD, USDCAD & EURCAD ---- PREDICTIONS PROVIDED IN YESTERDAY'S POST 10:04 PM T2W LOCAL TIME

GBPUSD, EURGBP, EURUSD, USDCAD & EURCAD results for 16th July 2020


Volatility Response Model (VRM) described in the first post of this thread.

EURCAD added to complete another triplet. Now there are two triplets.

EURGBP X GBPUSD = EURUSD

EURUSD X USDCAD = EURCAD

The FX pairs follow each other about their respective VRM levels. Good for additional trading signals !

The daily VRM charts below now only display the highest , lowest and S1 sentiments levels. These are the most important sentiment levels.

2 FILES ATTACHED - ALL LEVELS IN THE ATTACHED CHARTS WERE ON LAST POST

FIRST FILE


Weekly VRM levels in the top 3 hourcharts. Daily VRM levels in the bottom 3 hour charts . Daily VRM levels only valid for the last 24 hours. Times are GMT-3. EMA channel (4,7) included. All charts show the mid-price between the bid and the offer.

Thought I would post the 3 hour candlestick charts for a change tonight. The day starts 16th July with the 2am (GMT-3) 3 hour candlstick my Canadian Atlantic time. Notice how the OHLC of the 3 hour candlesticks line up well with the VRM levels. Only USDCAD needed to use an internal daily sentiment level 1.3504. All the other coloured levels in the charts did well. This is a good example of how 3 hour candlesticks are the heart beat of the FX markets. I have seen this many many times.

SECOND FILE

I also attach my overnight GBPUSD trade following the GBPUSD down from its daily S1 = 2592 to its daily level L1=1.2533. All levels on yesterday's post.
 

Attachments

  • 2020-07-16-1800-GBPUSD-EURGBP-EURUSD-USDCAD-EURCAD-3hr-3hr.png
    2020-07-16-1800-GBPUSD-EURGBP-EURUSD-USDCAD-EURCAD-3hr-3hr.png
    280.5 KB · Views: 150
  • 2020-07-16-GBPUSD-trades.png
    2020-07-16-GBPUSD-trades.png
    30.1 KB · Views: 181
Last edited:
I attach the VRM predictions for tomorrow for 17th July for GBPUSD, EURGBP, EURUSD, USDCAD & EURCAD.

Coloured levels are the important VRM levels. Watch out for the top, middle and bottom of the short term trend channel (blue) colliding with the top, middle or bottom of the long term trend channel (green).

I also attach VRM charts for AUDUSD, USDNZD and AUDNZD for 17th July. Study the VRM levels of each FX pair of the triplet to make your final trading decsion. I do not chart these FX pairs so will not present the results tomorrow.

==================== AUDUSD, USDNZD & AUDNZD LAST THREE CHARTS =======================
 

Attachments

  • gbpusd.PNG
    gbpusd.PNG
    63.6 KB · Views: 181
  • eurgbp.PNG
    eurgbp.PNG
    62.6 KB · Views: 173
  • eurusd.PNG
    eurusd.PNG
    61.8 KB · Views: 165
  • usdcad.PNG
    usdcad.PNG
    60.6 KB · Views: 179
  • eurcad.PNG
    eurcad.PNG
    60 KB · Views: 172
  • audusd.PNG
    audusd.PNG
    60 KB · Views: 168
  • usdnzd.PNG
    usdnzd.PNG
    61.6 KB · Views: 171
  • audnzd.PNG
    audnzd.PNG
    61.4 KB · Views: 174
GBPUSD, EURGBP, EURUSD, USDCAD & EURCAD ---- PREDICTIONS PROVIDED IN YESTERDAY'S POST 9:58 PM T2W LOCAL TIME

GBPUSD, EURGBP, EURUSD, USDCAD & EURCAD results for 17th July 2020


Volatility Response Model (VRM) described in the first post of this thread.

EURCAD added to complete another triplet. Now there are two triplets.

EURGBP X GBPUSD = EURUSD

EURUSD X USDCAD = EURCAD

The FX pairs follow each other about their respective VRM levels. Good for additional trading signals !

The daily VRM charts below now only display the highest , lowest and S1 sentiments levels. These are the most important sentiment levels.

2 FILES ATTACHED - ALL LEVELS IN THE ATTACHED CHARTS WERE ON LAST POST

FIRST FILE


Weekly VRM levels in the top 1 hour charts. Daily VRM levels in the bottom 1 hour charts . Daily VRM levels only valid for the last 24 hours. Times are GMT-3. EMA channel (4,7) included. All charts show the mid-price between the bid and the offer.

GBPUSD made its low today as EURGBP made its high at its weekly VRM levels 0.9127 and 0.9135. So GBPUSD was following EURGBP in the last 24 hours.

SECOND FILE


Shows the 3 hour candlestick charts with EMA channel (4.7) throughout the week with weekly VRM levels for the 5 FX pairs. All charts show the mid-price between the bid and the offer
 

Attachments

  • 2020-07-17-1800-GBPUSD-EURGBP-EURUSD-USDCAD-EURCAD-1hr-1hr.png
    2020-07-17-1800-GBPUSD-EURGBP-EURUSD-USDCAD-EURCAD-1hr-1hr.png
    311.4 KB · Views: 143
  • 2020-07-17-GBPUSD-EURGBP-EURUSD-USDCAD-EURCAD-3hr.png
    2020-07-17-GBPUSD-EURGBP-EURUSD-USDCAD-EURCAD-3hr.png
    154.1 KB · Views: 192
I attach the VRM predictions for tomorrow for 20th July for GBPUSD, EURGBP, EURUSD, USDCAD & EURCAD.

Coloured levels are the important VRM levels. Watch out for the top, middle and bottom of the short term trend channel (blue) colliding with the top, middle or bottom of the long term trend channel (green).

I also attach VRM charts for AUDUSD, USDNZD and AUDNZD for 20th July. Study the VRM levels of each FX pair of the triplet to make your final trading decsion. I do not chart these FX pairs so will not present the results tomorrow.

==================== AUDUSD, USDNZD & AUDNZD LAST THREE CHARTS =======================
 

Attachments

  • gbpusd.PNG
    gbpusd.PNG
    63.1 KB · Views: 167
  • eurgbp.PNG
    eurgbp.PNG
    62 KB · Views: 175
  • eurusd.PNG
    eurusd.PNG
    61.3 KB · Views: 157
  • usdcad.PNG
    usdcad.PNG
    59.9 KB · Views: 182
  • eurcad.PNG
    eurcad.PNG
    59.6 KB · Views: 180
  • audusd.PNG
    audusd.PNG
    59.8 KB · Views: 170
  • usdnzd.PNG
    usdnzd.PNG
    61.2 KB · Views: 165
  • audnzd.PNG
    audnzd.PNG
    61.5 KB · Views: 162
GBPUSD, EURGBP, EURUSD, USDCAD & EURCAD ---- PREDICTIONS PROVIDED IN YESTERDAY'S POST 4:41 PM T2W LOCAL TIME

GBPUSD, EURGBP, EURUSD, USDCAD & EURCAD results for 20th July 2020


Volatility Response Model (VRM) described in the first post of this thread.

EURCAD added to complete another triplet. Now there are two triplets.

EURGBP X GBPUSD = EURUSD

EURUSD X USDCAD = EURCAD

The FX pairs follow each other about their respective VRM levels. Good for additional trading signals !

The daily VRM charts below now only display the highest , lowest and S1 sentiments levels. These are the most important sentiment levels.

1 FILE ATTACHED - ALL LEVELS IN THE ATTACHED CHARTS WERE ON LAST POST

ONLY FILE


Weekly VRM levels in the top 1 hourcharts. Daily VRM levels in the bottom 1 hour charts . Daily VRM levels only valid for the last 24 hours. Times are GMT-3. EMA channel (4,7) included. All charts show the mid-price between the bid and the offer.
 

Attachments

  • 2020-07-20-1800-GBPUSD-EURGBP-EURUSD-USDCAD-EURCAD-1hr-1hr.png
    2020-07-20-1800-GBPUSD-EURGBP-EURUSD-USDCAD-EURCAD-1hr-1hr.png
    317.7 KB · Views: 127
I attach the VRM predictions for tomorrow for 21st July for GBPUSD, EURGBP, EURUSD, USDCAD & EURCAD.

Coloured levels are the important VRM levels. Watch out for the top, middle and bottom of the short term trend channel (blue) colliding with the top, middle or bottom of the long term trend channel (green).

I also attach VRM charts for AUDUSD, USDNZD and AUDNZD for 21st July. Study the VRM levels of each FX pair of the triplet to make your final trading decsion. I do not chart these FX pairs so will not present the results tomorrow.

==================== AUDUSD, USDNZD & AUDNZD LAST THREE CHARTS =======================

Attachments
 

Attachments

  • gbpusd.PNG
    gbpusd.PNG
    63.5 KB · Views: 154
  • eurgbp.PNG
    eurgbp.PNG
    61.9 KB · Views: 157
  • eurusd.PNG
    eurusd.PNG
    61.3 KB · Views: 148
  • usdcad.PNG
    usdcad.PNG
    60.1 KB · Views: 160
  • eurcad.PNG
    eurcad.PNG
    59.8 KB · Views: 157
  • audusd.PNG
    audusd.PNG
    59.2 KB · Views: 166
  • usdnzd.PNG
    usdnzd.PNG
    61.2 KB · Views: 162
  • audnzd.PNG
    audnzd.PNG
    61.2 KB · Views: 163
GBPUSD, EURGBP, EURUSD, USDCAD & EURCAD ---- PREDICTIONS PROVIDED IN YESTERDAY'S POST 9:48 PM T2W LOCAL TIME

GBPUSD, EURGBP, EURUSD, USDCAD & EURCAD results for 21st July 2020


Volatility Response Model (VRM) described in the first post of this thread.

EURCAD added to complete another triplet. Now there are two triplets.

EURGBP X GBPUSD = EURUSD

EURUSD X USDCAD = EURCAD

The FX pairs follow each other about their respective VRM levels. Good for additional trading signals !

The daily VRM charts below now only display the highest , lowest and S1 sentiments levels. These are the most important sentiment levels.

1 FILE ATTACHED - ALL LEVELS IN THE ATTACHED CHARTS WERE ON LAST POST

ONLY FILE


Weekly VRM levels in the top 1 hour charts. Daily VRM levels in the bottom 1 hour charts . Daily VRM levels only valid for the last 24 hours. Times are GMT-3. EMA channel (4,7) included. All charts show the mid-price between the bid and the offer.

Today provided a good example of the importance of the VRM short and long term trend channels for GBPUSD, EURGBP and EURUSD. Shown in blue on the attached charts.

GBPUSD arrived at the top of its short term trend channel at 1.2766

EURGBP arrived at the middle of its short term trend channel at 0.9000

EURUSD arrived at the top of its long term trend channel 1.1537 and the top of its short term trend channel at 1.1531

All these levels were in yesterday's post

EURGBP X GBPUSD = EURUSD by arbitrage....so they all cordinate about their trend channels.
 

Attachments

  • 2020-07-21-1800-GBPUSD-EURGBP-EURUSD-USDCAD-EURCAD-1hr-1hr.png
    2020-07-21-1800-GBPUSD-EURGBP-EURUSD-USDCAD-EURCAD-1hr-1hr.png
    361 KB · Views: 138
I attach the VRM predictions for tomorrow for 22nd July for GBPUSD, EURGBP, EURUSD, USDCAD & EURCAD.

Coloured levels are the important VRM levels. Watch out for the top, middle and bottom of the short term trend channel (blue) colliding with the top, middle or bottom of the long term trend channel (green).

I also attach VRM charts for AUDUSD, USDNZD and AUDNZD for 22nd July. Study the VRM levels of each FX pair of the triplet to make your final trading decsion. I do not chart these FX pairs so will not present the results tomorrow.

==================== AUDUSD, USDNZD & AUDNZD LAST THREE CHARTS =======================
 

Attachments

  • gbpusd.PNG
    gbpusd.PNG
    63.3 KB · Views: 154
  • eurgbp.PNG
    eurgbp.PNG
    61.8 KB · Views: 186
  • eurusd.PNG
    eurusd.PNG
    60.3 KB · Views: 173
  • usdcad.PNG
    usdcad.PNG
    60.5 KB · Views: 169
  • eurcad.PNG
    eurcad.PNG
    59.7 KB · Views: 180
  • audusd.PNG
    audusd.PNG
    59.8 KB · Views: 189
  • usdnzd.PNG
    usdnzd.PNG
    60.3 KB · Views: 163
  • audnzd.PNG
    audnzd.PNG
    61.4 KB · Views: 157
GBPUSD, EURGBP, EURUSD, USDCAD & EURCAD ---- PREDICTIONS PROVIDED IN YESTERDAY'S POST 10:29 PM T2W LOCAL TIME

GBPUSD, EURGBP, EURUSD, USDCAD & EURCAD results for 22nd July 2020


Volatility Response Model (VRM) described in the first post of this thread.

EURCAD added to complete another triplet. Now there are two triplets.

EURGBP X GBPUSD = EURUSD

EURUSD X USDCAD = EURCAD

The FX pairs follow each other about their respective VRM levels. Good for additional trading signals !

The daily VRM charts below now only display the highest , lowest and S1 sentiments levels. These are the most important sentiment levels.

2 FILES ATTACHED - ALL LEVELS IN THE ATTACHED CHARTS WERE ON LAST POST

TWO FILES

Show consecutive charts covering the full 24 hours


Weekly VRM levels in the top 30 minute charts. Daily VRM levels in the bottom 30 minute charts . Daily VRM levels only valid for the last 24 hours. Times are GMT-3. EMA channel (4,7) included. All charts show the mid-price between the bid and the offer.
 

Attachments

  • 2020-07-22-0948-GBPUSD-EURGBP-EURUSD-USDCAD-EURCAD-30min-30min.png
    2020-07-22-0948-GBPUSD-EURGBP-EURUSD-USDCAD-EURCAD-30min-30min.png
    303.5 KB · Views: 143
  • 2020-07-22-1800-GBPUSD-EURGBP-EURUSD-USDCAD-EURCAD-30min-30min.png
    2020-07-22-1800-GBPUSD-EURGBP-EURUSD-USDCAD-EURCAD-30min-30min.png
    358.8 KB · Views: 138
I attach the VRM predictions for tomorrow for 23rd July for GBPUSD, EURGBP, EURUSD, USDCAD & EURCAD.

Coloured levels are the important VRM levels. Watch out for the top, middle and bottom of the short term trend channel (blue) colliding with the top, middle or bottom of the long term trend channel (green).

I also attach VRM charts for AUDUSD, USDNZD and AUDNZD for 23rd July. Study the VRM levels of each FX pair of the triplet to make your final trading decsion. I do not chart these FX pairs so will not present the results tomorrow.

==================== AUDUSD, USDNZD & AUDNZD LAST THREE CHARTS =======================
 

Attachments

  • gbpusd.PNG
    gbpusd.PNG
    64 KB · Views: 211
  • eurgbp.PNG
    eurgbp.PNG
    61.3 KB · Views: 215
  • eurusd.PNG
    eurusd.PNG
    60.8 KB · Views: 215
  • usdcad.PNG
    usdcad.PNG
    60.8 KB · Views: 218
  • eurcad.PNG
    eurcad.PNG
    60.3 KB · Views: 219
  • audusd.PNG
    audusd.PNG
    60.2 KB · Views: 222
  • usdnzd.PNG
    usdnzd.PNG
    60.8 KB · Views: 223
  • audnzd.PNG
    audnzd.PNG
    61.3 KB · Views: 215
GBPUSD, EURGBP, EURUSD, USDCAD & EURCAD ---- PREDICTIONS PROVIDED IN YESTERDAY'S POST 10:03 PM T2W LOCAL TIME

GBPUSD, EURGBP, EURUSD, USDCAD & EURCAD results for 23rd July 2020


Volatility Response Model (VRM) described in the first post of this thread.

EURCAD added to complete another triplet. Now there are two triplets.

EURGBP X GBPUSD = EURUSD

EURUSD X USDCAD = EURCAD

The FX pairs follow each other about their respective VRM levels. Good for additional trading signals !

The daily VRM charts below now only display the highest , lowest and S1 sentiments levels. These are the most important sentiment levels.

2 FILES ATTACHED - ALL LEVELS IN THE ATTACHED CHARTS WERE ON LAST POST

FIRST FILE


Weekly VRM levels in the top 1 hour charts. Daily VRM levels in the bottom 1 hour charts . Daily VRM levels only valid for the last 24 hours. Times are GMT-3. EMA channel (4,7) included. All charts show the mid-price between the bid and the offer.

SECOND FILE

A snapshot during the day with weekly VRM levels in the top 15 minute charts. Daily VRM levels in the bottom 15 minute charts . Times are GMT-3. EMA channel (4,7) included. All charts show the mid-price between the bid and the offer.

EURUSD dominated the price action today with its move from the top of its long term trend channel at 1.1537 (and lowest daily sentiment level 1.1547) through to its weekly level 1.1626. Easy to see in the 15 minute charts.
 

Attachments

  • 2020-07-23-1800-GBPUSD-EURGBP-EURUSD-USDCAD-EURCAD-1hr-1hr.png
    2020-07-23-1800-GBPUSD-EURGBP-EURUSD-USDCAD-EURCAD-1hr-1hr.png
    316.8 KB · Views: 161
  • 2020-07-23-1735-GBPUSD-EURGBP-EURUSD-USDCAD-EURCAD-15min-15min.png
    2020-07-23-1735-GBPUSD-EURGBP-EURUSD-USDCAD-EURCAD-15min-15min.png
    300.1 KB · Views: 151
I attach the VRM predictions for tomorrow for 24th July for GBPUSD, EURGBP, EURUSD, USDCAD & EURCAD.

Coloured levels are the important VRM levels. Watch out for the top, middle and bottom of the short term trend channel (blue) colliding with the top, middle or bottom of the long term trend channel (green).

I also attach VRM charts for AUDUSD, USDNZD and AUDNZD for 24th July. Study the VRM levels of each FX pair of the triplet to make your final trading decsion. I do not chart these FX pairs so will not present the results tomorrow.

==================== AUDUSD, USDNZD & AUDNZD LAST THREE CHARTS =======================
 

Attachments

  • gbpusd.PNG
    gbpusd.PNG
    63.5 KB · Views: 208
  • eurgbp.PNG
    eurgbp.PNG
    61.3 KB · Views: 208
  • eurusd.PNG
    eurusd.PNG
    60.7 KB · Views: 225
  • usdcad.PNG
    usdcad.PNG
    60.6 KB · Views: 216
  • eurcad.PNG
    eurcad.PNG
    59.9 KB · Views: 206
  • audusd.PNG
    audusd.PNG
    59.6 KB · Views: 207
  • usdnzd.PNG
    usdnzd.PNG
    60.7 KB · Views: 216
  • audnzd.PNG
    audnzd.PNG
    61.3 KB · Views: 199
GBPUSD, EURGBP, EURUSD, USDCAD & EURCAD ---- PREDICTIONS PROVIDED IN YESTERDAY'S POST 10:02 PM T2W LOCAL TIME

GBPUSD, EURGBP, EURUSD, USDCAD & EURCAD results for 24th July 2020


Volatility Response Model (VRM) described in the first post of this thread.

EURCAD added to complete another triplet. Now there are two triplets.

EURGBP X GBPUSD = EURUSD

EURUSD X USDCAD = EURCAD

The FX pairs follow each other about their respective VRM levels. Good for additional trading signals !

The daily VRM charts below now only display the highest , lowest and S1 sentiments levels. These are the most important sentiment levels.

3 FILES ATTACHED - ALL LEVELS IN THE ATTACHED CHARTS WERE ON LAST POST

FIRST TWO FILES

Show consecutive charts covering the full 24 hours


Weekly VRM levels in the top 30 minute charts. Daily VRM levels in the bottom 30 minute charts . Daily VRM levels only valid for the last 24 hours. Times are GMT-3. EMA channel (4,7) included. All charts show the mid-price between the bid and the offer.

THIRD FILE


Shows the 3 hour candlestick charts with EMA channel (4.7) throughout the week with weekly VRM levels for the 5 FX pairs. All charts show the mid-price between the bid and the offer
 

Attachments

  • 2020-07-24-1240-GBPUSD-EURGBP-EURUSD-USDCAD-EURCAD-30min-30min.png
    2020-07-24-1240-GBPUSD-EURGBP-EURUSD-USDCAD-EURCAD-30min-30min.png
    293 KB · Views: 158
  • 2020-07-24-1800-GBPUSD-EURGBP-EURUSD-USDCAD-EURCAD-30min-30min.png
    2020-07-24-1800-GBPUSD-EURGBP-EURUSD-USDCAD-EURCAD-30min-30min.png
    298.7 KB · Views: 161
  • 2020-07-24-GBPUSD-EURGBP-EURUSD-USDCAD-EURCAD-3hr.png
    2020-07-24-GBPUSD-EURGBP-EURUSD-USDCAD-EURCAD-3hr.png
    155.1 KB · Views: 205
GBPUSD, EURGBP, EURUSD, USDCAD & EURCAD ---- PREDICTIONS PROVIDED IN YESTERDAY'S POST 10:02 PM T2W LOCAL TIME

GBPUSD, EURGBP, EURUSD, USDCAD & EURCAD results for 24th July 2020


Volatility Response Model (VRM) described in the first post of this thread.

EURCAD added to complete another triplet. Now there are two triplets.

EURGBP X GBPUSD = EURUSD

EURUSD X USDCAD = EURCAD

The FX pairs follow each other about their respective VRM levels. Good for additional trading signals !

The daily VRM charts below now only display the highest , lowest and S1 sentiments levels. These are the most important sentiment levels.

3 FILES ATTACHED - ALL LEVELS IN THE ATTACHED CHARTS WERE ON LAST POST

FIRST TWO FILES

Show consecutive charts covering the full 24 hours


Weekly VRM levels in the top 30 minute charts. Daily VRM levels in the bottom 30 minute charts . Daily VRM levels only valid for the last 24 hours. Times are GMT-3. EMA channel (4,7) included. All charts show the mid-price between the bid and the offer.

THIRD FILE

Shows the 3 hour candlestick charts with EMA channel (4.7) throughout the week with weekly VRM levels for the 5 FX pairs. All charts show the mid-price between the bid and the offer
Hi Graham, a few days ago I ran into your VRM thread. Interested to understand a little more about it I now read about the 'Triplet' thing in this last page and I'm wondering when and why did you introduce this new (to me) approach. If you could address me to more relevant page/post where I can read about it...
Just another question... what the chart software /platform you use (the one where this page chart are plotted on) ?
Thanks a lot 😉
Mark

Hi Mark,

You can find the VRM described in more detail on the first post of this thread in the attached document vrm-05.pdf.

Makes sense to me to analyse all three FX pairs in a triplet whatever technical analysis method you use. For instance

EURGBP X GBPUSD = EURUSD

So your technical analysis should be consistent. You cannot say that EURGBP and GBPUSD are both buys when your analysis says to sell EURUSD.

I attach today's hourly charts for the weekly VRM levels (top charts) and the daily VRM levels (bottom charts) for GBPUSD, EURGBP, EURUSD, USDCAD and ERUCAD. Daily VRM levels are only valid for the last 24 hours. FX markets start a new day at 6:00 pm my local time.

Here you have two triplets in these charts

EURGBP X GBPUSD = EURUSD and
EURUSD X USDCAD = EURCAD

You can see the FX pairs of each triplet moving about their respective VRM levels and then work out which FX pair is leading, following or just looking on.

I use CMC Markets charting
 

Attachments

  • 2020-08-18-1800-GBPUSD-EURGBP-EURUSD-USDCAD-EURCAD-1hr-1hr.png
    2020-08-18-1800-GBPUSD-EURGBP-EURUSD-USDCAD-EURCAD-1hr-1hr.png
    304.9 KB · Views: 160
I see the view count for this thread keeps rising every so often. So I thought of posting some more Volatility Response Model (VRM) predictions.

A quick overview of the VRM. The VRM is a mathematical expression which relates one candlestick to the next consecutive candlestick. This math stays the same between all historical candlesticks and so it takes one step into the future.

The math calculates the high (H) , low (L) and sentiment level (S) in the next future time period. Above this sentiment level the market is bullish. Below this sentiment level the market is bearish.

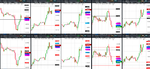
The math calculates these H, L and S levels out to eight days and eight weeks. So there are eight H levels, eight L levels and eight S levels. These are labelled in the VRM prediction charts as H1, L1, S1 through to H8, L8, S8. That's 24 levels. To simplify these levels I have found that the only important sentiment levels (S) are the highest, lowest and S1. The rest can be ignored.

The other predictions of the VRM are a daily short term trend channel and a weekly long term trend channel. I use these to gauge the bullishness and bearishness in the short term and the long term. The long term trend channel is shown in green on the VRM predictions and the short term trend channel is shown in blue.

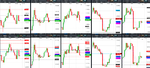
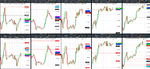
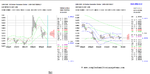
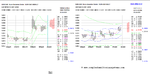
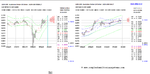
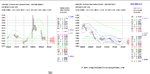
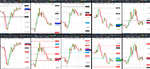
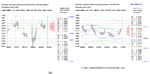
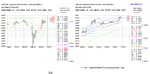
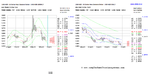
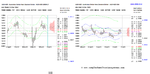
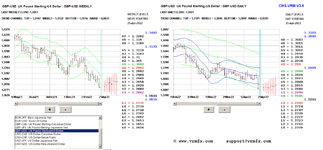
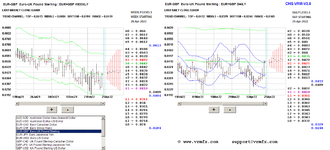
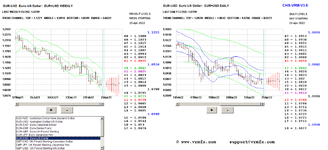
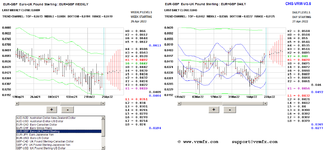
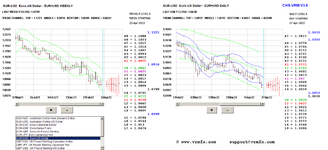
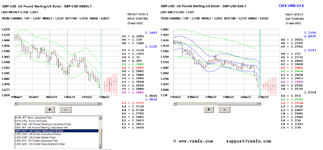
To trade FX, I usually have 2 charts to watch the FX market as it evolves. One weekly and one daily.

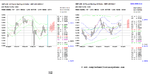
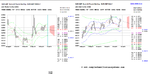
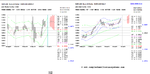
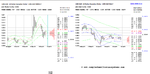
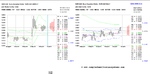
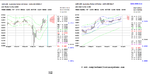
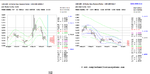
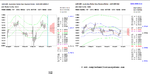
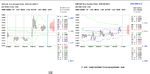
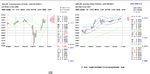
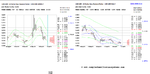
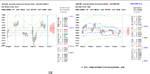
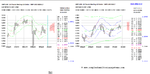
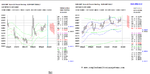
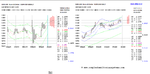
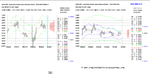
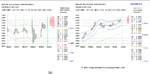
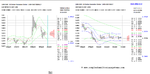
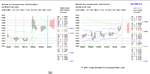
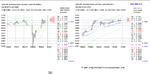
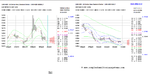
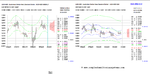
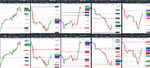
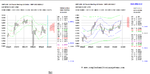
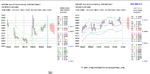
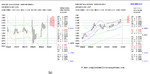
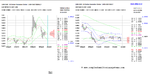
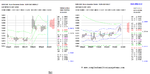
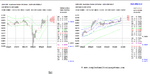
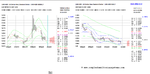
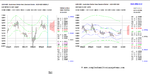
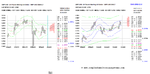
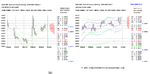
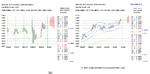
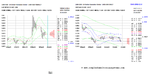
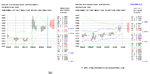
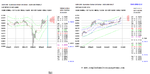
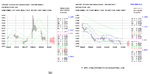
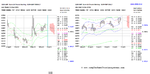
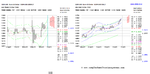
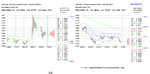
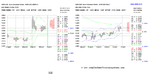
On the weekly chart I plot the lowest weekly H level, highest S level, S1 , lowest S level, highest L level. On the VRM prediction charts these are colour coded. I also plot the long term trend channel. These predictions last all week until the market closes Friday night.

Each day on the daily chart I plot the daily lowest H level, highest S level, S1, lowest S level, highest L level. On the VRM prediction charts these are colour coded. I also plot the short term trend channel. These predictions only last until the daily close in New York.

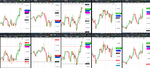
On these charts I also plot a EMA channel consisting of EMA(7) (red) and EMA(4) (blue) to see the FX market interacting with the VRM levels.

I attach a PDF file to this post describing the format of the prediction charts I will load onto T2W.

I plan to post predictions for GBP-USD, EUR-GBP and EUR-USD for Monday, Wednesday and Friday. The day after I will post a commentary on what happened on these days.

Observations, comments and questions are welcome.

G
 

Attachments

  • VRM-Predictions-Description-V01-13-04-2022.pdf
    115.4 KB · Views: 55
So here goes....

Here are the VRM predictions for GBP-USD, EUR-GBP and EUR-USD for tomorrow 25 April 2022

Commentary from me on Tuesday

See post #1057 on page 53 for a description of the VRM and a PDF describing the VRM charts attached.

G
 

Attachments

  • 2022-04-25-gbpusd.PNG
    2022-04-25-gbpusd.PNG
    68.1 KB · Views: 63
  • 2022-04-25-eurgbp.PNG
    2022-04-25-eurgbp.PNG
    69.7 KB · Views: 61
  • 2022-04-25-eurusd.PNG
    2022-04-25-eurusd.PNG
    68.3 KB · Views: 63
Commentary for price action of GBP-USD, EUR-GBP and EUR-USD about their respective VRM levels on 25 April 2022.

Price action shown in attached charts together with VRM predicted levels.

In these charts H and L levels are solid lines, sentiment levels are dashed lines. Top, middle and bottom of trend channels are coloured blue.

Markets opened Sunday 17:00 in the attached charts. Weekly VRM levels in the top charts. Daily VRM levels in the bottom charts

==============================================================

EUR-GBP opened at its daily H level 0.8425 and fell. EURUSD followed and GBP-USD followed on.

EUR-USD fell below its lowest daily sentiment level 1.0814 at 18:00 and was then a sell down to the bottom of its Short Term Trend Channel at 1.0706.

GBP-USD fell below its lowest daily sentiment level at 1.2846 and was then a sell. GBP-USD followed EUR-USD and fell to its weekly level 1.2702

Meanwhile EUR-GBP had support on the top of its Short Term Trend Channel at 0.8412 and rallied to its daily level 0.8440 before falling back following EUR-USD

============================================================

See post #1057 on page 53 for a description of the VRM and a PDF describing the VRM charts attached.

G
 

Attachments

  • 2022-04-25-1800-GBPUSD-EURGBP-EURUSD.PNG
    2022-04-25-1800-GBPUSD-EURGBP-EURUSD.PNG
    506.3 KB · Views: 59
Here are the VRM predictions for GBP-USD, EUR-GBP and EUR-USD for tomorrow 27 April 2022

GBP-USD fell through all its weekly VRM levels today 26th April. So tomorrow there are only its daily VRM levels to use.

Commentary from me on Thursday

See post #1057 on page 53 for a description of the VRM and a PDF file describing the VRM charts attached.

G
 

Attachments

  • 2022-04-27-eurgbp.PNG
    2022-04-27-eurgbp.PNG
    69.9 KB · Views: 58
  • 2022-04-27-eurusd.PNG
    2022-04-27-eurusd.PNG
    68.8 KB · Views: 57
  • 2022-04-27-gbpusd.PNG
    2022-04-27-gbpusd.PNG
    67.8 KB · Views: 59
Top