Predicting future FX support and resistance levels using mathematics

GBPUSD morning 06:58 (GMT-4) 26th October

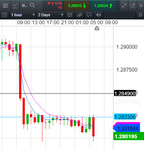
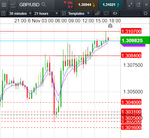
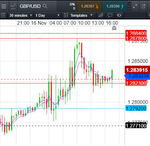
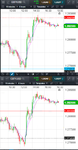
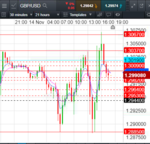
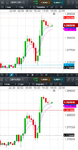
Anybody wondering what the GBPUSD has been doing for the last 19 hours...its been trying to reenter its VRM long term trend channel from the bottom at 1.2823 and failed. 1.2823 calculated last weekend before the markets opened Sunday.

Chart attached.
 

Attachments

  • 2018-10-26-GBPUSD-1hr-0658.png
    2018-10-26-GBPUSD-1hr-0658.png
    62.1 KB · Views: 155
GBPUSD follows EURUSD on the retracement 26th October

The 9 am (GMT-4) retracement of the GBPUSD followed the EURUSD as EURUSD bounced off its daily VRM level 1.1334. GBPUSD followed EURUSD. See attached 1 hour charts for GBPUSD on the left and EURUSD on the right with EMA(4,7) channels and daily VRM levels.
 

Attachments

  • 2018-10-26-GBPUSD-EURUSD-1hr-daily-levels.png
    2018-10-26-GBPUSD-EURUSD-1hr-daily-levels.png
    205.4 KB · Views: 126
GBPUSD & EURGBP results 30th October

Here are the results for GBPUSD & EURGBP using the VRM levels for today

Weekly VRM levels in the top 1 hour charts, daily VRM levels in the bottom 1 hour charts. Times are GMT-4 . EMA channel (4,7) included.

GBPUSD unable to break through daily S1 at 1.2809 falls to weekly level 1.2730. Where it retraces back to weekly level 1.2773. Then falling to its low for the day at daily level 1.2702.

Meanwhile EURGBP had support at its daily S1 level at 0.8883 and rose to the top of its short term trend channel at 0.8936

Lots of basis points to be made
 

Attachments

  • 2018-10-30-GBPUSD-EURGBP-1hr.png
    2018-10-30-GBPUSD-EURGBP-1hr.png
    442.1 KB · Views: 177
GBPUSD results for 31st October

Anyone using the weekly VRM levels for the GBPUSD presented in yesterday's post would have seen the attached 10 minute candlestick chart for today using the same weekly levels. EMA(4,7) channel. Atlantic Canada time.

GBPUSD rose from VRM weekly level 1.2703 through to weekly level 1.2773 during the chart time period
 

Attachments

  • 2018-10-31-GBPUSD-10min-1008.png
    2018-10-31-GBPUSD-10min-1008.png
    93.1 KB · Views: 137
Last edited:
GBPUSD result for 6th November

I attach the 30 minute candlestick chart for today (GMT-4) with daily VRM levels and EMA(4,7) channel.

Daily VRM level 1.3084 was the major resistance level for today. With a retracement back to daily S1 sentiment level at 1.3028 (black dash line). Break through of level 1.3084 finally occurred at 2 pm (GMT-4) rising to a high for the day at daily level 1.3107.

For a description of the significance of daily VRM sentiment levels see

https://www.complexhamiltoniansystems.com/theory.html#7th_PointHeader
 

Attachments

  • 2018-11-06-GBPUSD-daily-30min.png
    2018-11-06-GBPUSD-daily-30min.png
    108.3 KB · Views: 129
GBPUSD results for 9th November

I attach yesterday's GBPUSD price charts. Weekly VRM levels in the top 1 hour chart, daily VRM levels in the bottom 30 minute chart. Times are GMT-4 . EMA channel (4,7) included.

Over the last 3 days GBPUSD has fallen from the middle of its long term trend channel at 1.3157 and cascaded down weekly levels.

Yesterday the GBPUSD was unable to break up through its daily SI sentiment level 1.3067 (black dotted line) and fell to its daily level 1.3007. Then a brief rally back to its lowest daily sentiment level at 1.3057 before a final fall to the middle of its short term trend channel at 1.2978.

All this coordinated with EURGBP & EURUSD price action about their respective VRM levels. And that is another story.
 

Attachments

  • 2018-11-09-GBPUSD-30min-1hr.png
    2018-11-09-GBPUSD-30min-1hr.png
    243.7 KB · Views: 129
GBPUSD results for 14th November

I attach the 30 minute candlestick chart for today's GBPUSD. A volatile day.

Daily VRM levels are shown together with an EMA(4,7) channel. Time GMT-4

On the GBPUSD low for the day the VRM daily level 1.2885 was just about spot on.

The GBPUSD also bounced off the daily level 1.3037 twice .

After the second low of the day the GBPUSD rose to VRM level 1.3067.

The GBPUSD closed below its short term trend channel middle at 1.3019 so GBPUSD is still short term bearish.

Meanwhile EURGBP and EURUSD bounced about their respective VRM levels. And that is another story.
 

Attachments

  • 2018-11-14-GBPUSD-30min.png
    2018-11-14-GBPUSD-30min.png
    97.1 KB · Views: 126
GBPUSD results for 15th November

I attach the 1 hour candlestick charts for GBPUSD. Weekly VRM levels in the top chart, daily VRM levels in the bottom chart. EMA(4,7) channel in both. Time GMT-4.

As stated yesterday the GBPUSD was short term bearish. Today the GBPUSD tried to break up through its short term trend channel middle at 1.3022 and failed. Then kept dropping to weekly level 1.2744.

The significance of the top, middle and bottom of the short VRM short and long term trend channels is described at

https://www.complexhamiltoniansystems.com/practice.html#15th_PointHeader
 

Attachments

  • 2018-11-15-GBPUSD-1hr.png
    2018-11-15-GBPUSD-1hr.png
    162.3 KB · Views: 129
GBPUSD results for 16th November

I attach the 30 minute candlestick chart for GBPUSD with daily VRM levels on the chart and the EMA(4,7) channel. Time GMT-4.

GBPUSD started bullish on the New York open with support on the daily S1 sentiment level at 1.2771. (black dashed line).

On the day's rally the GBPUSD found resistance at daily level 1.2823 but then found support at the bottom of its short term trend channel at 1.2792.

Finally rallying to daily level 1.2878. I have today's GBPUSD high as 1.28782.
 

Attachments

  • 2018-11-16-GBPUSD-30min-daily.png
    2018-11-16-GBPUSD-30min-daily.png
    112.6 KB · Views: 133
EURUSD results for 20th November

Attached are the 1 hour candlestick charts for EURUSD for today 20th November . Weekly VRM levels in the top 1 hour charts, daily VRM levels in the bottom 1 hour charts. Times are GMT-4 . EMA channel (4,7) included.

As per my post on the eur/usd thread yesterday, the EURUSD made its high at its long term trend channel middle at 1.1474.

It then proceeded to fall for the rest of the day down to daily level 1.1367.

Along the way it paused for at least 3 hours at its lowest daily sentiment level 1.1432 and then again for at least 1 hour at its daily level 1.1401.
 

Attachments

  • 2018-11-20-EURUSD-1hr.png
    2018-11-20-EURUSD-1hr.png
    180.4 KB · Views: 126
GBPUSD results for 22nd November

Here are the results for GBPUSD. Weekly VRM levels in the top 1 hour chart, daily VRM levels in the bottom 1 hour chart. Times are GMT-4 . EMA channel (4,7) included.

GBPUSD started the 24 hours with support on the weekly level 1.2770 and the bottom of its long term trend channel 1.2766 (blue line)

GBPUSD spent at least 2 hours breaking up through the daily S1 sentiment level 1.2791 before the rapid rise to the daily level 1.2897.

GBPUSD then spent the next 11 hours trying to break up through the middle of its short term trend channel at 1.2888 and failed.
 

Attachments

  • 2018-11-22-GBPUSD-1hr.png
    2018-11-22-GBPUSD-1hr.png
    188.4 KB · Views: 125
EURUSD results for 26th November

I attach the 1 hour chart for EURUSD showing daily VRM levels and EMA(4,7) channel. Times are GMT-4

EURUSD found support at daily sentiment level 1.1330. Then rose to its high at the middle of its short term trend channel at 1.1385 (blue line). Finally falling back to 1.1330.

For a description of the significance of the middle of the short term trend channel see

https://www.complexhamiltoniansystems.com/practice.html#14th_PointHeader
 

Attachments

  • 2018-11-26-EURUSD-1hr-daily.png
    2018-11-26-EURUSD-1hr-daily.png
    91.8 KB · Views: 127
GBPUSD results for 28th November

I attach the 10 minute charts for GBPUSD around the Fed Chair Powell speech. Top chart shows weekly Volatility Response Model (VRM) levels and the bottom chart shows daily VRM levels. EMA(4,7) included . Time GMT-4.

This is an example of how volatility is described by the VRM levels. The low before the speech was at the bottom of the long term trend channel at 1.2744 (blue line).

The GBPUSD then rallied to its high at the weekly S1 level 1.2842.

In between the GBPUSD spent at least 40 minutes breaking through the daily level 1.2810.

The GBPUSD was a buy today as it had already found support on the weekly levels 1.2744 and 1.2738.

I also attach the 1 hour charts to complete the picture.
 

Attachments

  • 2018-11-28-GBPUSD-10min.png
    2018-11-28-GBPUSD-10min.png
    169.8 KB · Views: 150
  • 2018-11-28-GBPUSD-1hr.png
    2018-11-28-GBPUSD-1hr.png
    170.6 KB · Views: 133
Last edited:
GBPUSD results for 4th December

I attach the 1 hour charts for GBPUSD today. Top chart shows weekly Volatility Response Model (VRM) levels and the bottom chart shows daily VRM levels. EMA(4,7) included . Time GMT-4.

The GBPUSD started the 24 hours with support on its long term trend channel bottom at 1.2718 (blue line). By 23:00 (GMT-4) GBPUSD had found support on its daily S1 sentiment level at 1.2735.

GBPUSD then rallied to its weekly sentiment level at 1.2819. Finally falling to the bottom of its short term trend channel at 1.2660.

EURGBP and EURUSD coordinated their price actions about their respective VRM levels. And that is another story.

2018-12-04-GBPUSD-1hr.png
 
GBPUSD, EURGBP & EURUSD results for 7th December - US Nonfarm Payrolls

Here are the results for GBPUSD, EURGBP & EURUSD for 7th December - US Nonfarm Payrolls

TWO ATTACHMENTS

FIRST ATTACHMENT

Weekly VRM levels in the top 1 hour charts, daily VRM levels in the bottom 1 hour charts. Times are GMT-4 . EMA channel (4,7) included.

GBPUSD fell below its weekly S1 sentiment level 1.2782 early on and then fell below its daily S1 sentiment level at 1.2775 and was bearish for the rest of the day. Daily low was at weekly level 1.2711

EURGBP found support on its daily S1 sentiment level early on at 0.8894 and made its high at its daily level 0.8965

EURUSD had support at its daily S1 sentiment level 1.1366 and was unable to break through its long term trend channel middle at 1.1413

LAST ATTACHMENT

Show the 3 hour charts for the 3 FX throughout the week as they navigated their respective weekly VRM levels

Key weekly VRM levels throughout the week are shown.

2018-12-07-GBPUSD-EURGBP-EURUSD-1hr.png

2018-12-07-GBPUSD-EURGBP-EURUSD-3hr-week.png
 
GBPUSD & EURUSD results for 11th December

Here are the Volatility Response Model (VRM) results for GBPUSD & EURUSD.

Daily VRM levels in the 1 hour charts. Times are GMT-4 . EMA channel (4,7) included.

GBPUSD and EURUSD initially found support on their daily S1 sentiment levels at 1.2567 and 1.1362 respectively.

GBPUSD found resistance at its daily level 1.2616 while EURUSD found its resistance at its highest daily sentiment level 1.1399

GBPUSD and EURUSD then fell to their lows at daily level 1.2486 and daily level 1.1321 respectively

2018-12-11-GBPUSD-EURUSD-1hr-daily.png
 
GBPUSD & EURUSD results 14th December

Here are the results for GBPUSD & EURUSD using the VRM levels for yesterday

Weekly VRM levels in the top 1 hour charts, daily VRM levels in the bottom 1 hour charts. Times are GMT-4 . EMA channel (4,7) included.

Key events during the 24 hours.

GBPUSD was unable to break back up inside its long term trend channel bottom at 1.2661 and fell for the rest of the day to its daily level at 1.2538. In between times it found support at its daily levels 1.2604 and 1.2559 for short periods.

Meanwhile EURUSD started with support on its daily S1 sentiment level at 1.1357 before falling to its low at daily level 1.1283.

2018-12-14-GBPUSD-EURUSD-1hr.png
 
GBPUSD & EURUSD results 19th December

Here are the results for GBPUSD & EURUSD using the VRM levels for today

Weekly VRM levels in the top 1 hour charts, daily VRM levels in the bottom 1 hour charts. Times are GMT-4 . EMA channel (4,7) included.

Key level for GBPUSD today was the middle of its short term trend channel (daily blue line) at 1.2669. Unable to break through so GBPUSD is still short term bearish.

GBPUSD also twice tested the bottom of its long term trend channel at 1.2608 (weekly blue line)

Meanwhile EURUSD started the 24 hours bullish above its daily S1 sentiment level at 1.1359 And made its high as GBPUSD tried to break through its 1.2669 level. EURUSD fell back to the middle of its long term trend channel at 1.1364 on the Fed interest rate decision.

2018-12-19-GBPUSD-EURUSD-1hr.png
 
GBPUSD & EURUSD results 20th December

Here are the results for GBPUSD & EURUSD using the VRM levels for yesterday

Weekly VRM levels in the top 1 hour charts, daily VRM levels in the bottom 1 hour charts. Times are GMT-4 . EMA channel (4,7) included.

EURUSD started the 24 hours bullish above its daily S1 sentiment level 1.1378 and rose to its weekly level 1.1478. Then falling back to weekly level 1.1415 and then rallying to its daily level at 1.1485

GBPUSD moved in sync with EURUSD and made its high at its highest daily sentiment level 1.2708. Then falling back to its daily S1 sentiment level at 1.2633.

2018-12-20-GBPUSD-EURUSD-1hr.png
 
GBPUSD, EURGBP & EURUSD results 31st December 2018

Here are the results for GBPUSD, EURGBP & EURUSD using the VRM levels for today.

Weekly VRM levels in the top 30 minute charts, daily VRM levels in the bottom 30 minute charts. Times are GMT-4 . EMA channel (4,7) included.

Key events during the 24 hours.

EURUSD found support on its lowest daily sentiment level 1.1426 before rallying to its daily high at weekly sentiment level 1.1467

GBPUSD followed EURUSD from its low and rallied to its high for the day at its highest daily sentiment level 1.2810.

EURGBP fell and found support on its daily level 0.8978 for at least 3.5 hours before finally dropping to its daily low at weekly sentiment level 0.8932

Lots of gaps to trade between


2018-12-31-GBPUSD-EURGBP-EURUSD-30min.png
 
Top