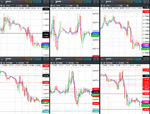
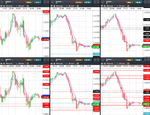
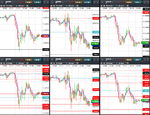
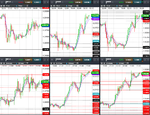
Predicting future FX support and resistance levels using mathematics

GBPUSD predictions for 21st May

I attach the VRM predictions for GBPUSD for tonight and tomorrow finishing 5 pm 21st May in New York.

The predictions are now in chart format and CSV format for input into charting systems. Predictions are in the column format of date, high, low, close, trend channel top, bottom and middle and 24 dual columns for the VRM levels. The last entry gives today's predictions and this week's predictions. The CSV file also gives past results for the VRM for back testing trading strategies. As the current day and week have not finished, the high, low and close entries are set to zero for these dates. The FX chart corresponds to the last daily and weekly CSV file entries.

Documents describing the Volatility Response Model (VRM) and the chart format can be found on the first post of this thread.

Predictions for VRM levels of EURGBP and EURUSD and 10 other FX pairs can be found at

https://www.complexhamiltoniansystems.com/fxcharts/

My current trading strategy is on page #20 post #157 of this thread.
 

Attachments

  • gbpusd.PNG
    gbpusd.PNG
    60.3 KB · Views: 124
  • GBP-USD-DAILY.CSV
    46 KB · Views: 107
  • GBP-USD-WEEKLY.CSV
    46 KB · Views: 108
GBPUSD, EURGBP & EURUSD results for 21st May

Yesterday I attached the predicted support and resistance levels of GBPUSD of the Volatility Response Model (VRM) for today.

EURGBP and EURUSD VRM levels and 10 other FX pairs were on the website

https://www.complexhamiltoniansystems.com/fxcharts/

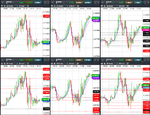
Here are the results for GBPUSD, EURGBP & EURUSD.

Weekly VRM levels in the top 30 minute charts, daily VRM levels in the bottom 30 minute charts. Times are GMT-4 . EMA channel (4,7) included.

GBPUSD high for the day at daily sentiment level 1.3484. Falling to the low for the day at daily level 1.3411 with a resistance level at the lowest weekly sentiment level 1.3435

EURGBP had a low for the day at its long term trend channel middle 0.8726

There were some large gaps between VRM levels to trade between.
 

Attachments

  • 2018-05-21-GBPUSD-EURGBP-EURUSD-30min.png
    2018-05-21-GBPUSD-EURGBP-EURUSD-30min.png
    366.8 KB · Views: 111
GBPUSD predictions for 22nd May

I attach the VRM predictions for GBPUSD for tonight and tomorrow finishing 5 pm 22nd May in New York.

The predictions are now in chart format and CSV format for input into charting systems. Predictions are in the column format of date, high, low, close, trend channel top, bottom and middle and 24 dual columns for the VRM levels. The last entry gives today's predictions and this week's predictions. The CSV file also gives past results for the VRM for back testing trading strategies. As the current day and week have not finished, the high, low and close entries are set to zero for these dates. The FX chart corresponds to the last daily and weekly CSV file entries.

Documents describing the Volatility Response Model (VRM) and the chart format can be found on the first post of this thread.

Predictions for VRM levels of EURGBP and EURUSD and 10 other FX pairs can be found at

https://www.complexhamiltoniansystems.com/fxcharts/

My current trading strategy is on page #20 post #157 of this thread.
 

Attachments

  • gbpusd.PNG
    gbpusd.PNG
    59.6 KB · Views: 100
  • GBP-USD-DAILY.CSV
    46 KB · Views: 127
  • GBP-USD-WEEKLY.CSV
    46 KB · Views: 117
GBPUSD, EURGBP & EURUSD results for 22nd May

Yesterday I attached the predicted support and resistance levels of GBPUSD of the Volatility Response Model (VRM) for today.

EURGBP and EURUSD VRM levels and 10 other FX pairs were on the website

https://www.complexhamiltoniansystems.com/fxcharts/

Here are the results for GBPUSD, EURGBP & EURUSD.

Weekly VRM levels in the top 30 minute charts, daily VRM levels in the bottom 30 minute charts. Times are GMT-4 . EMA channel (4,7) included.

GBPUSD followed EURUSD today starting at 4 am (GMT-4) when EURUSD launched from its lowest daily sentiment level at 1.1762.

Both arrived at their respective high levels 1.3487 and 1.1825 in the 5 am hour. And then fell for the rest of the day.

There were some large gaps between VRM levels to trade between.
 

Attachments

  • 2018-05-22-GBPUSD-EURGBP-EURUSD-30min.png
    2018-05-22-GBPUSD-EURGBP-EURUSD-30min.png
    366.2 KB · Views: 109
GBPUSD predictions for 23rd May

I attach the VRM predictions for GBPUSD for tonight and tomorrow finishing 5 pm 23rd May in New York.

The predictions are now in chart format and CSV format for input into charting systems. Predictions are in the column format of date, high, low, close, trend channel top, bottom and middle and 24 dual columns for the VRM levels. The last entry gives today's predictions and this week's predictions. The CSV file also gives past results for the VRM for back testing trading strategies. As the current day and week have not finished, the high, low and close entries are set to zero for these dates. The FX chart corresponds to the last daily and weekly CSV file entries.

Documents describing the Volatility Response Model (VRM) and the chart format can be found on the first post of this thread.

Predictions for VRM levels of EURGBP and EURUSD and 10 other FX pairs can be found at

https://www.complexhamiltoniansystems.com/fxcharts/

My current trading strategy is on page #20 post #157 of this thread.
 

Attachments

  • GBP-USD-WEEKLY.CSV
    46 KB · Views: 101
  • GBP-USD-DAILY.CSV
    46 KB · Views: 99
  • gbpusd.PNG
    gbpusd.PNG
    59.6 KB · Views: 82
GBPUSD, EURGBP & EURUSD results for 23rd May

Yesterday I attached the predicted support and resistance levels of GBPUSD of the Volatility Response Model (VRM) for today.

EURGBP and EURUSD VRM levels and 10 other FX pairs were on the website

https://www.complexhamiltoniansystems.com/fxcharts/

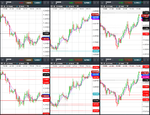
Here are the results for GBPUSD, EURGBP & EURUSD.

Weekly VRM levels in the top 30 minute charts, daily VRM levels in the bottom 30 minute charts. Times are GMT-4 . EMA channel (4,7) included.

GBPUSD high for the day at lowest weekly sentiment level 1.3435. At the same time EURUSD high for the day at daily S1 sentiment level 1.1784.

Then downhill all day to the low at level 1.3310 for GBPUSD and level 1.1673 for EURUSD. Both FX pairs went to their short term trend channel bottoms.

EURGBP bounced of its short term trend channel middle at 0.8749

There were some large gaps between VRM levels to trade between.
 

Attachments

  • 2018-05-23-GBPUSD-EURGBP-EURUSD-30min.png
    2018-05-23-GBPUSD-EURGBP-EURUSD-30min.png
    353.1 KB · Views: 84
GBPUSD predictions for 24th May

I attach the VRM predictions for GBPUSD for tonight and tomorrow finishing 5 pm 24th May in New York.

The predictions are now in chart format and CSV format for input into charting systems. Predictions are in the column format of date, high, low, close, trend channel top, bottom and middle and 24 dual columns for the VRM levels. The last entry gives today's predictions and this week's predictions. The CSV file also gives past results for the VRM for back testing trading strategies. As the current day and week have not finished, the high, low and close entries are set to zero for these dates. The FX chart corresponds to the last daily and weekly CSV file entries.

Documents describing the Volatility Response Model (VRM) and the chart format can be found on the first post of this thread.

Predictions for VRM levels of EURGBP and EURUSD and 10 other FX pairs can be found at

https://www.complexhamiltoniansystems.com/fxcharts/

My current trading strategy is on page #20 post #157 of this thread.
 

Attachments

  • gbpusd.PNG
    gbpusd.PNG
    58.9 KB · Views: 113
  • GBP-USD-DAILY.CSV
    46 KB · Views: 93
  • GBP-USD-WEEKLY.CSV
    46 KB · Views: 89
GBPUSD, EURGBP & EURUSD results for 24th May

Yesterday I attached the predicted support and resistance levels of GBPUSD of the Volatility Response Model (VRM) for today.

EURGBP and EURUSD VRM levels and 10 other FX pairs were on the website

https://www.complexhamiltoniansystems.com/fxcharts/

Here are the results for GBPUSD, EURGBP & EURUSD.

Weekly VRM levels in the top 30 minute charts, daily VRM levels in the bottom 30 minute charts. Times are GMT-4 . EMA channel (4,7) included.

GBPUSD found support at the weekly level cluster 1.3350 and 1.3354.

Then rallied to its high at level 1.3420. At the same time EURUSD reached its high at level 1.1746

EURGBP bounced off its lowest daily sentiment level 0.8738

There were some large gaps between VRM levels to trade between.
 

Attachments

  • 2018-05-24-GBPUSD-EURGBP-EURUSD-30min.png
    2018-05-24-GBPUSD-EURGBP-EURUSD-30min.png
    365.9 KB · Views: 80
GBPUSD predictions for 25th May

I attach the VRM predictions for GBPUSD for tonight and tomorrow finishing 5 pm 25th May in New York.

The predictions are now in chart format and CSV format for input into charting systems. Predictions are in the column format of date, high, low, close, trend channel top, bottom and middle and 24 dual columns for the VRM levels. The last entry gives today's predictions and this week's predictions. The CSV file also gives past results for the VRM for back testing trading strategies. As the current day and week have not finished, the high, low and close entries are set to zero for these dates. The FX chart corresponds to the last daily and weekly CSV file entries.

Documents describing the Volatility Response Model (VRM) and the chart format can be found on the first post of this thread.

Predictions for VRM levels of EURGBP and EURUSD and 10 other FX pairs can be found at

https://www.complexhamiltoniansystems.com/fxcharts/

My current trading strategy is on page #20 post #157 of this thread.
 

Attachments

  • GBP-USD-WEEKLY.CSV
    46 KB · Views: 99
  • GBP-USD-DAILY.CSV
    46 KB · Views: 107
  • gbpusd.PNG
    gbpusd.PNG
    59.7 KB · Views: 82
GBPUSD, EURGBP & EURUSD results for 25th May

Yesterday I attached the predicted support and resistance levels of GBPUSD of the Volatility Response Model (VRM) for today.

EURGBP and EURUSD VRM levels and 10 other FX pairs were on the website

https://www.complexhamiltoniansystems.com/fxcharts/

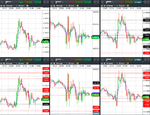
Here are the results for GBPUSD, EURGBP & EURUSD.

Weekly VRM levels in the top 1 hour charts, daily VRM levels in the bottom 30 minute charts. Times are GMT-4 . EMA channel (4,7) included.

GBPUSD fell through daily S1 sentiment level 1.3375 after opening. And then fell to daily level 1.3312.

Meanwhile EURUSD bounced between its top daily sentiment level 1.1734 and its bottom daily sentiment level 1.1690. Before finally falling to daily level 1.1643.

There were some large gaps between VRM levels to trade between.
 

Attachments

  • 2018-05-25-GBPUSD-EURGBP-EURUSD-1hr-30min.png
    2018-05-25-GBPUSD-EURGBP-EURUSD-1hr-30min.png
    331.4 KB · Views: 110
GBPUSD predictions for 28th May

I attach the VRM predictions for GBPUSD for tonight and tomorrow finishing 5 pm 28th May in New York.

The predictions are now in chart format and CSV format for input into charting systems. Predictions are in the column format of date, high, low, close, trend channel top, bottom and middle and 24 dual columns for the VRM levels. The last entry gives today's predictions and this week's predictions. The CSV file also gives past results for the VRM for back testing trading strategies. As the current day and week have not finished, the high, low and close entries are set to zero for these dates. The FX chart corresponds to the last daily and weekly CSV file entries.

Documents describing the Volatility Response Model (VRM) and the chart format can be found on the first post of this thread.

Predictions for VRM levels of EURGBP and EURUSD and 10 other FX pairs can be found at

https://www.complexhamiltoniansystems.com/fxcharts/

My current trading strategy is on page #20 post #157 of this thread.
 

Attachments

  • gbpusd.PNG
    gbpusd.PNG
    58.9 KB · Views: 88
  • GBP-USD-DAILY.CSV
    46 KB · Views: 93
  • GBP-USD-WEEKLY.CSV
    46 KB · Views: 100
GBPUSD, EURGBP & EURUSD results for 28th May

Yesterday I attached the predicted support and resistance levels of GBPUSD of the Volatility Response Model (VRM) for today.

EURGBP and EURUSD VRM levels and 10 other FX pairs were on the website

https://www.complexhamiltoniansystems.com/fxcharts/

Here are the results for GBPUSD, EURGBP & EURUSD.

Weekly VRM levels in the top 30 minute charts, daily VRM levels in the bottom 30 minute charts. Times are GMT-4 . EMA channel (4,7) included.

GBPUSD spent the day amongst its daily sentiment levels.

GBPUSD started with support at daily S1 sentiment level at 1.3310 . Then rose to its high at daily sentiment level 1.3340 then fell to its low at the lowest daily sentiment level 1.3299

Meanwhile EURGBP made the daily high at its daily level 0.8794 at the same time EURUSD made its daily high at its level 1.1730.

EURGBP and EURUSD both fell to their respective daily levels 0.8727 and 1.1619 respectively.

There were some large gaps between VRM levels to trade between.
 

Attachments

  • 2018-05-28-GBPUSD-EURGBP-EURUSD-30min.png
    2018-05-28-GBPUSD-EURGBP-EURUSD-30min.png
    294.3 KB · Views: 114
GBPUSD predictions for 29th May

I attach the VRM predictions for GBPUSD for tonight and tomorrow finishing 5 pm 29th May in New York.

The predictions are now in chart format and CSV format for input into charting systems. Predictions are in the column format of date, high, low, close, trend channel top, bottom and middle and 24 dual columns for the VRM levels. The last entry gives today's predictions and this week's predictions. The CSV file also gives past results for the VRM for back testing trading strategies. As the current day and week have not finished, the high, low and close entries are set to zero for these dates. The FX chart corresponds to the last daily and weekly CSV file entries.

Documents describing the Volatility Response Model (VRM) and the chart format can be found on the first post of this thread.

Predictions for VRM levels of EURGBP and EURUSD and 10 other FX pairs can be found at

https://www.complexhamiltoniansystems.com/fxcharts/

My current trading strategy is on page #20 post #157 of this thread.
 

Attachments

  • gbpusd.PNG
    gbpusd.PNG
    59.1 KB · Views: 94
  • GBP-USD-DAILY.CSV
    46 KB · Views: 109
  • GBP-USD-WEEKLY.CSV
    46 KB · Views: 110
GBPUSD, EURGBP & EURUSD results for 29th May

Yesterday I attached the predicted support and resistance levels of GBPUSD of the Volatility Response Model (VRM) for today.

EURGBP and EURUSD VRM levels and 10 other FX pairs were on the website

https://www.complexhamiltoniansystems.com/fxcharts/

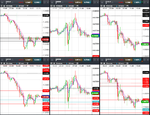
Here are the results for GBPUSD, EURGBP & EURUSD.

Weekly VRM levels in the top 30 minute charts, daily VRM levels in the bottom 30 minute charts. Times are GMT-4 . EMA channel (4,7) included.

GBPUSD high for the day was at daily sentiment level 1.3324.

GBPUSD then fell to the weekly level 1.3210 / daily level 1.3207.

Then rallied to the lowest daily sentiment level 1.3298 before falling to the bottom of the short term trend channel 1.3240.

As GBPUSD fell then EURUSD fell from its high at weekly S1 sentiment level 1.1642 down to its low at weekly level 1.1527

There were some large gaps between VRM levels to trade between.
 

Attachments

  • 2018-05-29-GBPUSD-EURGBP-EURUSD-30min.png
    2018-05-29-GBPUSD-EURGBP-EURUSD-30min.png
    363.4 KB · Views: 95
GBPUSD predictions for 30th May

I attach the VRM predictions for GBPUSD for tonight and tomorrow finishing 5 pm 30th May in New York.

The predictions are now in chart format and CSV format for input into charting systems. Predictions are in the column format of date, high, low, close, trend channel top, bottom and middle and 24 dual columns for the VRM levels. The last entry gives today's predictions and this week's predictions. The CSV file also gives past results for the VRM for back testing trading strategies. As the current day and week have not finished, the high, low and close entries are set to zero for these dates. The FX chart corresponds to the last daily and weekly CSV file entries.

Documents describing the Volatility Response Model (VRM) and the chart format can be found on the first post of this thread.

Predictions for VRM levels of EURGBP and EURUSD and 10 other FX pairs can be found at

https://www.complexhamiltoniansystems.com/fxcharts/

My current trading strategy is on page #20 post #157 of this thread.
 

Attachments

  • gbpusd.PNG
    gbpusd.PNG
    58.4 KB · Views: 85
  • GBP-USD-DAILY.CSV
    46 KB · Views: 93
  • GBP-USD-WEEKLY.CSV
    46 KB · Views: 93
GBPUSD, EURGBP & EURUSD results for 30th May

Yesterday I attached the predicted support and resistance levels of GBPUSD of the Volatility Response Model (VRM) for today.

EURGBP and EURUSD VRM levels and 10 other FX pairs were on the website

https://www.complexhamiltoniansystems.com/fxcharts/

Here are the results for GBPUSD, EURGBP & EURUSD.

Weekly VRM levels in the top 1 hour charts, daily VRM levels in the bottom 30 minute charts. Times are GMT-4 . EMA channel (4,7) included.

GBPUSD followed EURUSD upwards today. EURUSD found support on weekly level 1.1527 at midnight and GBPUSD followed.

GBPUSD high for the day at daily level 1.3300

EURUSD high for the day at daily level 1.1667

There were some large gaps between VRM levels to trade between.
 

Attachments

  • 2018-05-30-GBPUSD-EURGBP-EURUSD-1hr-30min.png
    2018-05-30-GBPUSD-EURGBP-EURUSD-1hr-30min.png
    474.3 KB · Views: 88
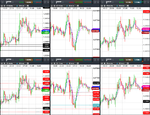
GBPUSD predictions for 31st May

I attach the VRM predictions for GBPUSD for tonight and tomorrow finishing 5 pm 31st May in New York.

The predictions are now in chart format and CSV format for input into charting systems. Predictions are in the column format of date, high, low, close, trend channel top, bottom and middle and 24 dual columns for the VRM levels. The last entry gives today's predictions and this week's predictions. The CSV file also gives past results for the VRM for back testing trading strategies. As the current day and week have not finished, the high, low and close entries are set to zero for these dates. The FX chart corresponds to the last daily and weekly CSV file entries.

Documents describing the Volatility Response Model (VRM) and the chart format can be found on the first post of this thread.

Predictions for VRM levels of EURGBP and EURUSD and 10 other FX pairs can be found at

https://www.complexhamiltoniansystems.com/fxcharts/

My current trading strategy is on page #20 post #157 of this thread.
 

Attachments

  • gbpusd.PNG
    gbpusd.PNG
    58.9 KB · Views: 94
  • GBP-USD-DAILY.CSV
    46 KB · Views: 104
  • GBP-USD-WEEKLY.CSV
    46 KB · Views: 89
GBPUSD 5 minute chart today so far

I attach the 5 minute GBPUSD charts so far

Weekly VRM levels in the top 5 minute chart, daily VRM levels in the bottom 5 minute chart. Times are GMT-4 . EMA channel (4,7) included.

GBPUSD weekly S1 sentiment level 1.3343 featured again today. The market was unable to pull the EMA(4,7) channel through this level.

The market then fell to the daily S1 sentiment level 1.3278 where many orders were waiting.

Market rallied back up to the highest daily sentiment level 1.3334 then fell back again to daily S1 level.
 

Attachments

  • 2018-05-31-GBPUSD-5min.png
    2018-05-31-GBPUSD-5min.png
    114.3 KB · Views: 91
GBPUSD, EURGBP & EURUSD results for 31st May

Yesterday I attached the predicted support and resistance levels of GBPUSD of the Volatility Response Model (VRM) for today.

EURGBP and EURUSD VRM levels and 10 other FX pairs were on the website

https://www.complexhamiltoniansystems.com/fxcharts/

Here are the results for GBPUSD, EURGBP & EURUSD.

Weekly VRM levels in the top 30 minute charts, daily VRM levels in the bottom 30 minute charts. Times are GMT-4 . EMA channel (4,7) included.

Also see my last post today with the 5 minute charts attached to show the trades available and the levels where bounces occurred at this time scale.

There were some large gaps between VRM levels to trade between.
 

Attachments

  • 2018-05-31-GBPUSD-EURGBP-EURUSD-30min.png
    2018-05-31-GBPUSD-EURGBP-EURUSD-30min.png
    442.9 KB · Views: 109
Top