GBPUSD, EURGBP & EURUSD results for 13th April
Yesterday I attached the predicted support and resistance levels of GBPUSD of the Volatility Response Model (VRM) for today.
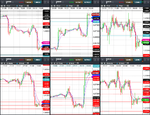
EURGBP and EURUSD VRM levels and 10 other FX pairs were on the website
https://www.complexhamiltoniansystems.com/fxcharts/
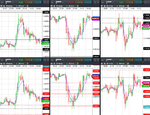
Here are the results for GBPUSD, EURGBP & EURUSD.
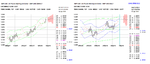
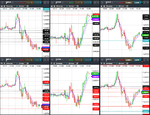
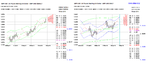
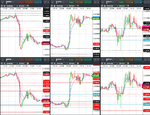
Weekly VRM levels in the top 30 minute charts, daily VRM levels in the bottom 30 minute charts. Times are GMT-4 . EMA channel (4,7) included.
Today the GBPUSD had support at the daily sentiment level 1.4228 and then bounced up to weekly level 1.4298 which was also a daily level today.
Remember that the weekly level 1.4298 was calculated last weekend using weekly high/low/close data and the daily level 1.4298 was calculated using last nights high/low/close. Two different data sets gave the same level.
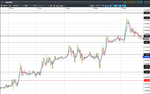
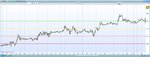
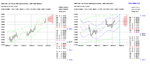
EURUSD again bounced off its short term trend channel middle at 1.2309
There were some large gaps between VRM levels to trade between.
Yesterday I attached the predicted support and resistance levels of GBPUSD of the Volatility Response Model (VRM) for today.
EURGBP and EURUSD VRM levels and 10 other FX pairs were on the website
https://www.complexhamiltoniansystems.com/fxcharts/
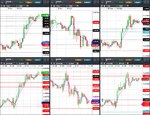
Here are the results for GBPUSD, EURGBP & EURUSD.
Weekly VRM levels in the top 30 minute charts, daily VRM levels in the bottom 30 minute charts. Times are GMT-4 . EMA channel (4,7) included.
Today the GBPUSD had support at the daily sentiment level 1.4228 and then bounced up to weekly level 1.4298 which was also a daily level today.
Remember that the weekly level 1.4298 was calculated last weekend using weekly high/low/close data and the daily level 1.4298 was calculated using last nights high/low/close. Two different data sets gave the same level.
EURUSD again bounced off its short term trend channel middle at 1.2309
There were some large gaps between VRM levels to trade between.