Predicting future FX support and resistance levels using mathematics

hi gka, you clearly have an impressive level of maths modeling and programming ability here im sure there could be a way forward for you in trading if thats what you want to do. im not sure you are gonna achieve much by sharing the "VRM" levels on here though, i think they will effectively be meaningless to anyone other than you to be frank. what would perhaps be a more constructive use of your time would be to build on your strengths and focus on writing and testing robots/EAs/algorithms for doing the trading. just some feedback.
kind regards
kso

Hi kso thank you for your feedback. I am coming at this project as a mathematician and looking for feedback. I see upwards of 150-200 views a day and some downloads of the CSV files so I assume that viewers are looking for levels of interest. trade2win helps by recording the predictions and then the results so building some sort of track record. Probably the way forward is to work with a hedge fund or bank.
 
GBPUSD predictions for 9th April

I attach the VRM predictions for GBPUSD for tonight and tomorrow finishing 5 pm 9th April in New York.

The predictions are now in chart format and CSV format for input into charting systems. Predictions are in the column format of date, high, low, close, trend channel top, bottom and middle and 24 dual columns for the VRM levels. The last entry gives today's predictions and this week's predictions. The CSV file also gives past results for the VRM for back testing trading strategies. As the current day and week have not finished, the high, low and close entries are set to zero for these dates. The FX chart corresponds to the last daily and weekly CSV file entries.

Documents describing the Volatility Response Model (VRM) and the chart format can be found on the first post of this thread.

Predictions for VRM levels of EURGBP and EURUSD and 10 other FX pairs can be found at

https://www.complexhamiltoniansystems.com/fxcharts/

My current trading strategy is on page #20 post #157 of this thread.
 

Attachments

  • gbpusd.PNG
    gbpusd.PNG
    58.6 KB · Views: 133
  • GBP-USD-DAILY.CSV
    46 KB · Views: 169
  • GBP-USD-WEEKLY.CSV
    46 KB · Views: 182
GBPUSD, EURGBP & EURUSD results for 9th April

Yesterday I attached the predicted support and resistance levels of GBPUSD of the Volatility Response Model (VRM) for today.

EURGBP and EURUSD VRM levels and 10 other FX pairs were on the website

https://www.complexhamiltoniansystems.com/fxcharts/

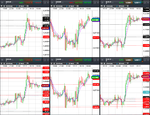
Here are the results for GBPUSD, EURGBP & EURUSD.

Weekly VRM levels in the top 30 minute charts, daily VRM levels in the bottom 30 minute charts. Times are GMT-4 . EMA channel (4,7) included.

GBPUSD high for the day was at the weekly sentiment level 1.4154

There were some large gaps between VRM levels to trade between.
 

Attachments

  • 2018-04-09-GBPUSD-EURGBP-EURUSD-30min.png
    2018-04-09-GBPUSD-EURGBP-EURUSD-30min.png
    427.8 KB · Views: 119
GBPUSD predictions for 10th April

I attach the VRM predictions for GBPUSD for tonight and tomorrow finishing 5 pm 10th April in New York.

The predictions are now in chart format and CSV format for input into charting systems. Predictions are in the column format of date, high, low, close, trend channel top, bottom and middle and 24 dual columns for the VRM levels. The last entry gives today's predictions and this week's predictions. The CSV file also gives past results for the VRM for back testing trading strategies. As the current day and week have not finished, the high, low and close entries are set to zero for these dates. The FX chart corresponds to the last daily and weekly CSV file entries.

Documents describing the Volatility Response Model (VRM) and the chart format can be found on the first post of this thread.

Predictions for VRM levels of EURGBP and EURUSD and 10 other FX pairs can be found at

https://www.complexhamiltoniansystems.com/fxcharts/

My current trading strategy is on page #20 post #157 of this thread.
 

Attachments

  • gbpusd.PNG
    gbpusd.PNG
    58.3 KB · Views: 121
  • GBP-USD-DAILY.CSV
    46 KB · Views: 177
  • GBP-USD-WEEKLY.CSV
    46 KB · Views: 170
Hi kso thank you for your feedback. I am coming at this project as a mathematician and looking for feedback. I see upwards of 150-200 views a day and some downloads of the CSV files so I assume that viewers are looking for levels of interest. trade2win helps by recording the predictions and then the results so building some sort of track record. Probably the way forward is to work with a hedge fund or bank.

People coming to a trading forum would naturally be interested in a thread titled "Predicting future FX support and resistance....." If there are CSVs to click on, they will click... but then basically we go back to what I said.

btw have you compared your levels with pivot points? are they any better?
 
Hi Everyone, My name is Graham and I am a mathematician here in Canada.

There are lots of different technical analysis methods to determine future support and resistance levels. They can be subjective and depend upon experience. I have been wondering whether support and resistance levels can be determined mathematically and now have a working algorithm I call the Volatility Response Model (VRM).

The VRM calculates future support and resistance levels either one day ahead or one week ahead, together with short and long term trend channels. These predictions are not extrapolations from the past. I attach a white paper describing the algorithm.

I am looking for FX traders for feedback, discussions and opinions on the VRM predictions. To this end I will post predictions in this thread as markets progress.

Here is the first set of predictions for GBPUSD in chart format starting 5 pm New York time tonight. The second attached paper describes the format of these predictions on the chart. They are essentially 24 weekly levels and 24 daily levels. The latter will last until 5 pm New York time tomorrow night. Tomorrow night after the close in New York I will post the GBPUSD market price action and the VRM levels on the same chart.


Predicting future FX support and resistance levels using telepathy.

This nonsense is no where near as complicated as what you're suggesting. Its all to do with supply and demand.
 
Predicting future FX support and resistance levels using telepathy.

This nonsense is no where near as complicated as what you're suggesting. Its all to do with supply and demand.

I cannot understand your comment.

You replace the word mathematics with "telepathy" in this thread title. Yet all the financial trading industry is based around mathematics of one form or another. What about SMA or EMA or Bollinger Bands or Fibonacci levels. All mathematics.

Second you say that "Its all to do with supply and demand" . Is that not just the bullishness or bearishness of a market. And when the supply is greater than demand then markets go down and vice-versa. And Investopedia gives the definition of Forex Pivot Points

https://www.investopedia.com/terms/forex/f/forex-pivot-points.asp

as levels where market sentiment has gone from bullish to bearish. And pivot points are calculated........using mathematics.

So are you saying that all FX trading using whatever indicator they believe in created using mathematics is...............telepathy?
 
Last edited:
People coming to a trading forum would naturally be interested in a thread titled "Predicting future FX support and resistance....." If there are CSVs to click on, they will click... but then basically we go back to what I said.

btw have you compared your levels with pivot points? are they any better?

I think the VRM levels are better. I look around the Internet for other pivot predictions. Such as

https://www.dailyfx.com/pivot-points

Today the GBPUSD high for the day is at weekly VRM sentiment levels 1.4188/1.4189 calculated last weekend. I have the high for GBPUSD for the day as 1.41886.

The GBPUSD low for the day is at VRM daily sentiment level 1.4120. I have the GBPUSD low as 1.41199

Does anyone else reading this comment have the level 1.4188 as a level for the high for the day or 1.4120 as the level for the low for the day?
 
GBPUSD, EURGBP & EURUSD results for 10th April

Yesterday I attached the predicted support and resistance levels of GBPUSD of the Volatility Response Model (VRM) for today.

EURGBP and EURUSD VRM levels and 10 other FX pairs were on the website

https://www.complexhamiltoniansystems.com/fxcharts/

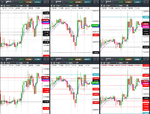
Here are the results for GBPUSD, EURGBP & EURUSD.

Weekly VRM levels in the top 1 hour charts, daily VRM levels in the bottom 1 hour charts. Times are GMT-4 . EMA channel (4,7) included.

GBPUSD low for the day was at the daily sentiment level 1.4120

GBPUSD high for the day was at the weekly sentiment level 1.4188

There were some large gaps between VRM levels to trade between.
 

Attachments

  • 2018-04-10-GBPUSD-EURGBP-EURUSD-30min.png
    2018-04-10-GBPUSD-EURGBP-EURUSD-30min.png
    353.1 KB · Views: 103
I think the VRM levels are better. I look around the Internet for other pivot predictions. Such as https://www.dailyfx.com/pivot-points

Well if you simply say they are "better" then that's all explained then (y) :rolleyes:

Today the GBPUSD high for the day is at weekly VRM sentiment levels 1.4188/1.4189 calculated last weekend. I have the high for GBPUSD for the day as 1.41886.

The GBPUSD low for the day is at VRM daily sentiment level 1.4120. I have the GBPUSD low as 1.41199

Does anyone else reading this comment have the level 1.4188 as a level for the high for the day or 1.4120 as the level for the low for the day?

You mean out of the 24 lines you chucked on the chart, GBP got quite close to one ? :clap: well done mate
 
Last edited:
Well if you simply say they are "better" then that's all explained then (y) :rolleyes:


You mean out of the 24 lines you chucked on the chart it got quite close to one ? :clap: well done mate

I didn't chuck them on a chart. The mathematics calculated them And it wasn't one level it was two. My recommendation to you is to stop reading this thread. You are wasting your time.
 
I didn't chuck them on a chart. The mathematics calculated them And it wasn't one level it was two. My recommendation to you is to stop reading this thread. You are wasting your time.
you call it maths, i call it chuck.. whatever

i'm wasting my time pointing out that you are wasting your time... hmm that's an interesting one.
 
GBPUSD predictions for 11th April

I attach the VRM predictions for GBPUSD for tonight and tomorrow finishing 5 pm 11th April in New York.

The predictions are now in chart format and CSV format for input into charting systems. Predictions are in the column format of date, high, low, close, trend channel top, bottom and middle and 24 dual columns for the VRM levels. The last entry gives today's predictions and this week's predictions. The CSV file also gives past results for the VRM for back testing trading strategies. As the current day and week have not finished, the high, low and close entries are set to zero for these dates. The FX chart corresponds to the last daily and weekly CSV file entries.

Documents describing the Volatility Response Model (VRM) and the chart format can be found on the first post of this thread.

Predictions for VRM levels of EURGBP and EURUSD and 10 other FX pairs can be found at

https://www.complexhamiltoniansystems.com/fxcharts/

My current trading strategy is on page #20 post #157 of this thread.
 

Attachments

  • GBP-USD-WEEKLY.CSV
    46 KB · Views: 169
  • GBP-USD-DAILY.CSV
    46 KB · Views: 156
  • gbpusd.PNG
    gbpusd.PNG
    58.4 KB · Views: 120
GBPUSD, EURGBP & EURUSD results for 11th April

Yesterday I attached the predicted support and resistance levels of GBPUSD of the Volatility Response Model (VRM) for today.

EURGBP and EURUSD VRM levels and 10 other FX pairs were on the website

https://www.complexhamiltoniansystems.com/fxcharts/

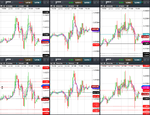
Here are the results for GBPUSD, EURGBP & EURUSD.

Weekly VRM levels in the top 30 minute charts, daily VRM levels in the bottom 30 minute charts. Times are GMT-4 . EMA channel (4,7) included.

GBPUSD high for the day was at its highest weekly sentiment level 1.4225

GBPUSD low for the day was at the daily sentiment level 1.4159

EURUSD is attempting to break through the middle of its long term trend channel 1.2369

EURGBP spent 11 hours trying to rise above its weekly S1 sentiment level 0.8797 and failed

There were some large gaps between VRM levels to trade between.
 

Attachments

  • 2018-04-11-GBPUSD-EURGBP-EURUSD-30min.png
    2018-04-11-GBPUSD-EURGBP-EURUSD-30min.png
    331.9 KB · Views: 122
GBPUSD predictions for 12th April

I attach the VRM predictions for GBPUSD for tonight and tomorrow finishing 5 pm 12th April in New York.

The predictions are now in chart format and CSV format for input into charting systems. Predictions are in the column format of date, high, low, close, trend channel top, bottom and middle and 24 dual columns for the VRM levels. The last entry gives today's predictions and this week's predictions. The CSV file also gives past results for the VRM for back testing trading strategies. As the current day and week have not finished, the high, low and close entries are set to zero for these dates. The FX chart corresponds to the last daily and weekly CSV file entries.

Documents describing the Volatility Response Model (VRM) and the chart format can be found on the first post of this thread.

Predictions for VRM levels of EURGBP and EURUSD and 10 other FX pairs can be found at

https://www.complexhamiltoniansystems.com/fxcharts/

My current trading strategy is on page #20 post #157 of this thread.
 

Attachments

  • gbpusd.PNG
    gbpusd.PNG
    57.9 KB · Views: 85
  • GBP-USD-DAILY.CSV
    46 KB · Views: 142
  • GBP-USD-WEEKLY.CSV
    46 KB · Views: 150
I attach the VRM predictions for GBPUSD for tonight and tomorrow finishing 5 pm 12th April in New York.

The predictions are now in chart format and CSV format for input into charting systems. Predictions are in the column format of date, high, low, close, trend channel top, bottom and middle and 24 dual columns for the VRM levels. The last entry gives today's predictions and this week's predictions. The CSV file also gives past results for the VRM for back testing trading strategies. As the current day and week have not finished, the high, low and close entries are set to zero for these dates. The FX chart corresponds to the last daily and weekly CSV file entries.

Documents describing the Volatility Response Model (VRM) and the chart format can be found on the first post of this thread.

Predictions for VRM levels of EURGBP and EURUSD and 10 other FX pairs can be found at

https://www.complexhamiltoniansystems.com/fxcharts/

My current trading strategy is on page #20 post #157 of this thread.

Does it provide trading signals or give possible range of volatility in near-term outlook? How it considers incoming news which can greatly affect it?
 
Does it provide trading signals or give possible range of volatility in near-term outlook? How it considers incoming news which can greatly affect it?

Thank you for your questions.

I attach the current GBPUSD 30 minute charts today to explain my understanding of the maths. EMA(4,7) channel also plotted. Top chart shows the weekly VRM levels. Bottom chart shows today's VRM levels.

Markets are waiting for news and other times trending. The VRM levels are levels about which the market retraces or reverses. So today the GBPUSD sold off down to weekly VRM level 1.4149 and then bounced up to weekly level 1.4244 which was also a daily level. Buyers came in at 1.4149 and drove the market up.

In the near-term such as daily, the market will respond to news such as the NFP and move accordingly. The point is that the market's response will be about the VRM levels. The VRM does not know what the volatility will be, only that the response will be about the VRM levels.

So the VRM levels are possible bounce levels. The VRM does not say that a market will bounce at a level only that it could bounce there.

I use the EMA(4,7) channel to assess a retracement or a reversal. I have noticed that when markets move too fast and too far then reversals occur when the candlestick has detached from the EMA(4,7) channel. This happened toady at level 1.4149. These reversals happen at VRM levels.

The VRM also provides short term and long term trend channels. The range (top to bottom) of these channels give you an idea of how much the market can meander or rapidly move with sudden news without changing its trend direction. This week the GBPUSD has been bullish in the short and long term as it has been moving above the middle of these rising channels. So that is one way to gauge the bullish/bearishness of a market.

Markets will have an opinion about anticipated news. I have noticed that markets will retrace back to daily S1 sentiment level shortly before the news is announced. I think this indicates that the market is neutral and has no opinion. Other times the market will move to the other side of the short term trend channel in order to change its opinion from bullish to bearish or visa-versa.

Hope this explains the VRM
 

Attachments

  • 2018-04-12-GBPUSD-30min-1535.png
    2018-04-12-GBPUSD-30min-1535.png
    119 KB · Views: 100
Last edited:
So today the GBPUSD sold off down to the bottom bollinger band and took out the lows as predicted by my eyes and VRM mouse, then bounced up to the upper band...

75n7y


:clap:
 
Last edited:
GBPUSD, EURGBP & EURUSD results for 12th April

Yesterday I attached the predicted support and resistance levels of GBPUSD of the Volatility Response Model (VRM) for today.

EURGBP and EURUSD VRM levels and 10 other FX pairs were on the website

https://www.complexhamiltoniansystems.com/fxcharts/

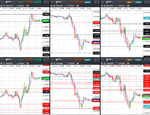
Here are the results for GBPUSD, EURGBP & EURUSD.

Weekly VRM levels in the top 30 minute charts, daily VRM levels in the bottom 30 minute charts. Times are GMT-4 . EMA channel (4,7) included.

Today the GBPUSD sold off down to weekly VRM level 1.4149 and then bounced up to weekly level 1.4244 which was also a daily level.

EURGBP & EURUSD were always bearish today as they were unable to rise above their respective daily S1 sentiment levels of 0.8725 and 1.2379 respectively.

EURUSD also bounced off its short term trend channel middle 1.2305

There were some large gaps between VRM levels to trade between.
 

Attachments

  • 2018-04-12-GBPUSD-EURGBP-EURUSD-30min.png
    2018-04-12-GBPUSD-EURGBP-EURUSD-30min.png
    357.2 KB · Views: 126
GBPUSD predictions for 13th April

I attach the VRM predictions for GBPUSD for tonight and tomorrow finishing 5 pm 13th April in New York.

The predictions are now in chart format and CSV format for input into charting systems. Predictions are in the column format of date, high, low, close, trend channel top, bottom and middle and 24 dual columns for the VRM levels. The last entry gives today's predictions and this week's predictions. The CSV file also gives past results for the VRM for back testing trading strategies. As the current day and week have not finished, the high, low and close entries are set to zero for these dates. The FX chart corresponds to the last daily and weekly CSV file entries.

Documents describing the Volatility Response Model (VRM) and the chart format can be found on the first post of this thread.

Predictions for VRM levels of EURGBP and EURUSD and 10 other FX pairs can be found at

https://www.complexhamiltoniansystems.com/fxcharts/

My current trading strategy is on page #20 post #157 of this thread.
 

Attachments

  • gbpusd.PNG
    gbpusd.PNG
    58.3 KB · Views: 109
  • GBP-USD-DAILY.CSV
    46 KB · Views: 144
  • GBP-USD-WEEKLY.CSV
    46 KB · Views: 132
Top