Best Thread Potential setups

Status
Not open for further replies.
bbmac,

Is this site trustfull?

GBP/JPY is showing a huge gap down as well .. At 148.527!

I`m short in both.. GBP/JPY I did get sttoped for 10pips or so.. Let`s see..

Can be a useful guide to new open price and has proved to be in the past. Seems a big gap down, but you never know, it's happened before (many times) so not out of the realms of possibility and in gbpusd as I was alluding to in my previous posts (with other posters too) there is certainly the potential for resistance in the area it closed, so wouldn't be surprised to see some sell orders emerge there. I'm flat so not really bothered here. G/l with your open positions though.
 
i have a long term eu open (1.33) from last week off the daily chart. i plan to hold it trailing my stop behind swing lows as long as i can. ultimate target is around 1.4 but profit taking at 1.35 (already taken), 1.37 and 1.39
 
This DOW. I have drawn these daily channels does anyone else agree they are roughly correct.

As looking at that its almost at the top a daily trendline.

maybe time to consider going short.
 

Attachments

  • daily trend line.gif
    daily trend line.gif
    39 KB · Views: 141
AUD/USD hitting major resistance

Hi peeps.

Happy mothers day to all ya'muthers.

Anyway I've been checking the historical charts and keeping tabs on the AUD/USD. This AUD has risen quite substantially since March and recently touched the long term, descending resistance line from way waaaay back.

There is a potential setup here.

:sneaky:
 

Attachments

  • audusd may 09.gif
    audusd may 09.gif
    29.8 KB · Views: 151
This DOW. I have drawn these daily channels does anyone else agree they are roughly correct.

As looking at that its almost at the top a daily trendline.

maybe time to consider going short.

My view on the Dow, which doesn't answer your question about channels I'm afraid, is as follows.

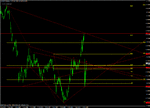
The first chart shows that price is right up against a trend line that's been tested 2 times with price currently about to test it for a 3rd time which would confirm it.

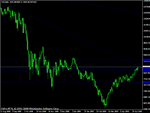
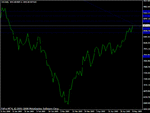
The second chart shows daily support and resistance - I draw mine using a line chart (with candles for confirmation) and you can see price tested 8500 and pulled back, tried again and broke through and closed on Friday just above what looks to me like a weak previous level of support at 8560. The question to me is whether this downtrendline will act as resistance or whether we'll see another move up followed by a retest of 8500 and I'm looking for price action to give a clue to where we go next.

090510 - daily candle.gif

090510 - daily line.gif
 
could someone help me please i am using the ig charts and i am trying to set up m average
nbr = days which i set at 20
horizontal shift (what do i set this at as i m not sure)
vertical shift (same applies i m nt sure)

could someone advise me please

also do i need to to set fast slow and expotential on the ig charts there is dema and tema could you explain exactly what they mean
thank you in advance

Hi Welsh,
I leave the shifts at zero on my settings and my MA's look okay.
For the rest of your question I'm sorry I can't understand which indicator/feature you mean.
 
This DOW. I have drawn these daily channels does anyone else agree they are roughly correct.

As looking at that its almost at the top a daily trendline.

maybe time to consider going short.

from my perspective this could be due for a rise, must be patient though and see if the pattern plays out. the FTSE is similar, I am stalking a long term long.
 

Attachments

  • dw.gif
    dw.gif
    23.5 KB · Views: 267
from my perspective this could be due for a rise, must be patient though and see if the pattern plays out. the FTSE is similar, I am stalking a long term long.


Very nice perspective! Looks plausable. A slight down few weeks coming in the next few weeks of may and then it will start rising into the summer.
Crude looks good for a rise aswell.
 
gbpusd

Re post #6898 cable finding some support in that 5195-50 prev sw hi zone 1hr +4hr after a re-test of friday's hi overnight has seen it sell through the 23.6% of the 4940-5248 (fri Hi) swing up.

Dly Pivot is at 5147 area, initial support likely down to there, with a 1hr ascending trend line near by current price too.
 
gbpusd

Cable trading between the resistance and potential rbs (previous resistance zone) at the moment with a slightly bearish tone so far-intraday.

5po0g5.gif
 
Heads up.
The aud/chf daily pin from 3 days ago has also moved thru the level.
 
Audjpy

For anyone watching yen pairs and looking at this as a pullback before continued weakness in the yen, here's an area I'm watching. Major daily pivot where resistance has become support, fib confluence and daily trendline.

090511 - daily.gif

090511 - closeup.gif
 
Got a weekly pin on nasdaq do the downside...... already broken in london morning session. Pretty much confirming a short bias for the week for me...........

do whatever tho.......
 
crude

There is a hammer (pin bar) on the hourly crude, thats on a 4hr ascending trendline and 50% of last swing hi/low and off $57 which was Fridays low.
Hasn't broken yet.
 
Eur Usd

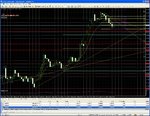
Hi everyone, after 2 losing trades earlier trying to buy EURUSD, decided to go short with a few lots around 1.3635. I know this is a countertrend trade trading a retracement of the main trend, but it hit a SR level (high from 20th March. I entered on the bases of LH LL on the 5 minute chart to be honest. Currently have my stop between my two lowest entries. Question is, how low will this one retrace befor making a significant upside move or return to the daily trend. I have marked in fibs and SR levels at 1.3560, 1.349, 1.345. Any ideas on the strongest likelihood of the turning point here?? Currently looking like it might take out my stop with a 2-bar reversal pattern...:(

Addendum 1: Foolishly took profit on a minor retrace earlier. Now only have 4 lots on, but have moved those stops just over breakeven now. Anyone have any viewpoints on turning points for this short?

Regards Chris
 

Attachments

  • EUR-USD-20090511.JPG
    EUR-USD-20090511.JPG
    436.3 KB · Views: 184
Last edited:
Status
Not open for further replies.
Top