ilplusq
Member
- Messages
- 88
- Likes
- 21
ACHTUNG ALLES Pinbarhunters!
Firstly, I thank all veterans who repped me. I started trading from scratch less than 6 month ago and I have a long way to go. Your approval of my charts is definitely mood-upgrading for a beginner who trades alone. Now to the point:
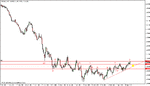
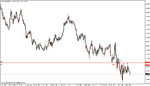
GBPCAD: Price rejected at the level of previous support on Feb 2. The level is dashed on the charts because it is not a significant level yet, although there is a confluence with 61.8% fib from Jan low. A so-so pinbar has formed on the Daily chart. If you look up from the pin, there is a forest of S/R pivots, and then there is a potential TL. So I ask myself, what is the chance of getting anywhere near 1:1 R:R or better here? - there is harldly any room. This is not the kind of setup I would take, even if the pinbar was 5/5. I hope others will join me in showing that pinbars mean nothing by themselves, which I already learnt the hard way. Look forward to your comments.
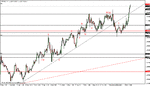
(weekly chart included for bigger picture)
-Ilya
Firstly, I thank all veterans who repped me. I started trading from scratch less than 6 month ago and I have a long way to go. Your approval of my charts is definitely mood-upgrading for a beginner who trades alone. Now to the point:
GBPCAD: Price rejected at the level of previous support on Feb 2. The level is dashed on the charts because it is not a significant level yet, although there is a confluence with 61.8% fib from Jan low. A so-so pinbar has formed on the Daily chart. If you look up from the pin, there is a forest of S/R pivots, and then there is a potential TL. So I ask myself, what is the chance of getting anywhere near 1:1 R:R or better here? - there is harldly any room. This is not the kind of setup I would take, even if the pinbar was 5/5. I hope others will join me in showing that pinbars mean nothing by themselves, which I already learnt the hard way. Look forward to your comments.
(weekly chart included for bigger picture)
-Ilya
Attachments
Last edited: