Best Thread Potential setups

Status
Not open for further replies.
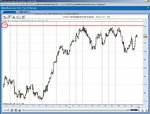
USD/JPY a possible short? what are the long term fundamental views against?

Its coming down off the 50% fib so could be a good trade.
I've no idea on fundamentals. Probably all up in the air at the moment anayway.
 
Its coming down off the 50% fib so could be a good trade.
I've no idea on fundamentals. Probably all up in the air at the moment anayway.

cheers rikrok,
out of curiosity, where have drawn your fib lines from, which prices and timeframe?
I've never fully grasped the conventions people use for drawing fib lines...

thanks
 
Cable is going to be a sell on any rally towards 141.08 March Future.

I think this is going to tank.

First target 140.14.

Second 138.47.

Third 134.92.
 
BUND 1hr

BUND 1hr
 

Attachments

  • Bund 1hr.JPG
    Bund 1hr.JPG
    162.9 KB · Views: 151
You should be feeding them caviar for the rest of their life.

I hope you didn't come out.

But if you did, don't worry. Because the real move is going to happen today.

And trust me, you don't want to miss this.

I held on to all my positions mate.
Offloaded this morn for 58% roi.:)
Probably make another move after lunch time. I need to be more patient during the rallies this time. Could have had over 80% from fridays move.
I think the dow is going to die for the next six months at least tbh. Propably another record low next q.

Anyone fancy HSBC to die when the yanks wake up?
 

Attachments

  • HSBC.JPG
    HSBC.JPG
    99.3 KB · Views: 156
cheers rikrok,
out of curiosity, where have drawn your fib lines from, which prices and timeframe?
I've never fully grasped the conventions people use for drawing fib lines...

thanks


Here;s a copy of mine for what its worth (I'm still using L plates myself)
drawn from low to most recent peak.
Can also set them to the previous higher peak and look for confluence between the two sets of fibs.....
 

Attachments

  • usdjpy.doc
    66.5 KB · Views: 187

I am actually eyeing a long on this market... I want to see where this mini relief move in stocks takes us, then if we see selling on the dow at the US open I am targeting the upper 125's. Initial, obvious place to enter for me would be that 125.09 hitting the EMA 21 and 50.
 

Attachments

  • bundss.JPG
    bundss.JPG
    223.3 KB · Views: 172
Dante,
Key level here in the Cash Dow and you know it! Drop below and it's turn the lights out time
Still think we'll see 7800-8000 this week!!
 
Dante,
Key level here in the Cash Dow and you know it! Drop below and it's turn the lights out time
Still think we'll see 7800-8000 this week!!

I keep hearing the relief rally is going to come...but I'm only seeing red candles...

Perhaps it will come at 6000.

Surely by 5000.

If not, then 4000 should hold it.

3000 without a doubt.

2000 would be buy of the century.

Keep tuning into CNBC. Lots of optimists on there.

Although they are quickly running out of levels.
 
Here and 6350, don't care what anyone else says. Don't get CNBC anymore, cost cutting. LOL
 
Pa

Anyone play these other James16 PA patterns or are they less reliable than the famous Pin Bars? :

BUOB/BEOB
DBHLC/DBLHC
 
I cant see the dow or ftse turing around any time soon? It seems to just be bad news followed by bad news? Shorting the dow and holding out for a week would have pick you up 600 points :-S

Im thinking 3500 is the realistic figure for the next week or so if the other banks jump on HSBC bandwagon. Seems like they're all at loggerheads with the govt lol.

Anyone got any ideas on what could cause a turn around and a bottom figure and why?
 
Anyone got any ideas on what could cause a turn around and a bottom figure and why?

Well, a war is usually a starter for 10. War is good for an economy. The Argies tried it in 1982 but ity didn't work out for them (they tried to avert attention from the diving economy at the time and invaded the Falklands).

So, who could the US start on next?

Failing that, who knows? When pessimism is at its worst and no-one in the world would dare buy stocks - ultimate contrarian view - that's a good buy signal. Takes balls!
 
H&S on gold 240min chart. Could be a good long if it failed.
 

Attachments

  • @yg HnS.jpg
    @yg HnS.jpg
    51.3 KB · Views: 136
I found a page with some trading setups..
Trade Setups
The thing is.. you have to keep at it.. when you start changing it is when it invariably goes wrong as you're changing the system... to win at trading you have to lose unfortunately.... it's a probability game..
It's not easy.. I've been eyeing the markets for yonks now and still haven't made it despite researching and testing all the time!
 
Don't you just love being stopped out of the market, twice, on 2 different trades, when 3 chart providers show the same price and your stop not being hit....only to be told by SB company that we use the Bid price and in both cases the bid prices hit the stop. Charts are only indicative?!
 
Don't you just love being stopped out of the market, twice, on 2 different trades, when 3 chart providers show the same price and your stop not being hit....only to be told by SB company that we use the Bid price and in both cases the bid prices hit the stop. Charts are only indicative?!

which company? Sounds like u need to ditch them
 
Good old CMC. Hit stop by 50cents on Gold and 1 pip on Dow Yest. They said they use the bid tick data to open/close trades. Just have to add another pip or 2 every time I draw exit/entry lines on my MT4 charts etc!
 
Anyone looking to short this rally and look for a gap fill on the FTSE Futures chart this morning? I guess this buying is the selling absorption from yesterday.
 
Status
Not open for further replies.
Top