Hi Tom,
I see everything is going well, I'm very happy for you. I like price action too, no indicators, no EMAs... I love how you master Jim's teachings..you're my idol
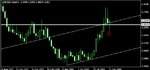
Here a nice situation on USD/SEK
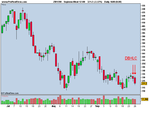
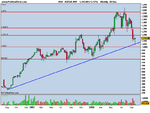
Let's start from the weekly. 6,55 is a really strong area and actually it's supporting price. Last week formed a nice pin bar off that support. You can also see a dynamic support
I think that a long on the break of the pin is a good signal. Pin bars on lower time frames can give lower risk entry points
p.s. please let me know about every your initiative..such us posts on other forum or websites virtual tradingroom and so on..I want to improve my trading from you
Canados,
Some good points you mention on that USD/SEK setup.
A few points to make though:
Firstly, I stay away from the exotics because I don't follow them. I like to monitor many markets but to paraphrase my personal idol Jesse Livermore - restrict your speculations to the most actively traded markets. If you cannot make money in these, you will not be able to make money in others. Similar to what Jim (J16) taught me when he said keep to the Weekly and daily TFs. If you cannot make money on these, why do you think you can make money on the 1, 3 or 5m where the trader must be faster to think and faster to execute. So USD/SEK is a no go for me on this principle alone. I keep to what I know well. In FX this is mainly EUR/USD, GBP/USD and USD/JPY (and sometimes a few other JPY pairs such as EUR/JPY and GBP/JPY.
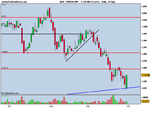
Secondly, although the level is good on that chart, I like the markets to swing into my pins. That is to say, I like to see a sharp move down into a pin or a sharp move up into one that has been sustained over several bars. Think of the elastic band theory - the further you pull it back, the harder it will fly
🙂
Thirdly, if you want to know about my "initiatives" you need only look as far as this forum: My Making Money Trading thread and this one which I sometimes post in and my journal which I actually may soon be stopping because of work restrictions.
However, to become a master of the markets you need to spend time with them. Reading alone will not help you.
You need
screen time. Hours upon ours of studying charts, making observations, recording movements, analysing previous price movements and you need to do this work in isolation.
.png")