traders today i willshow you how to trade by taking into consideration 1hr charts but taking entry based on 15 min for max or best potential price.
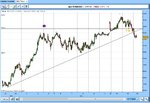
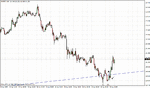
now you can see a double test of 130 area with 2 arrows in 1 hour chart. This means price has tested 130 area twice and settled above . At this moment of time you must think about building long positions.. but taking entry on 15 min chart..
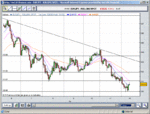
now look at same chart 15 min
2 arrows are the same double test.. now when prices move up obviously its gonna meet some sell interst at rally. so we wait for it to get sold off again in the chart i have pointed that out by a cross "x" thats your selling...
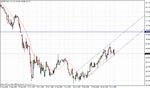
now the candle marked with tick is the candle which nulllifies the sell interest or the high of previous candle .. at this moment to go long and put your stops below the double test ..
i hope you got this ideaology